RStudio in Galaxy
OverviewQuestions:Objectives:
How can I manipulate data using R in Galaxy?
Launch RStudio in Galaxy
Time estimation: 3 hoursLast modification: Oct 18, 2022
Introduction
This tutorial is significantly based on the Carpentries “Intro to R and RStudio for Genomics” lesson
RStudio is an Integrated Development Environment (IDE). Like most IDEs, it provides a graphical interface to R, making it more user-friendly, and providing dozens of useful features. We will introduce additional benefits of using RStudio as you cover the lessons. In this case, we are specifically using RStudio Server, a version of RStudio that can be accessed in your web browser. RStudio Server has the same features of the Desktop version of RStudio you could download as standalone software.
AgendaIn this tutorial, we will cover:
RStudio
Opening up RStudio Tool: interactive_tool_rstudio in Galaxy is easy:
Hands-on: Launch RStudioDepending on which server you are using, you may be able to run RStudio directly in Galaxy. If that is not available, RStudio Cloud can be an alternative.
Launch RStudio in Galaxy Currently RStudio in Galaxy is only available on UseGalaxy.eu and UseGalaxy.org
- Open the Rstudio tool tool by clicking here to launch RStudio
- Click Execute
- The tool will start running and will stay running permanently
- Click on the “User” menu at the top and go to “Active InteractiveTools” and locate the RStudio instance you started.
Launch RStudio Cloud if not available on Galaxy If RStudio is not available on the Galaxy instance:
- Register for RStudio Cloud, or login if you already have an account
- Create a new project
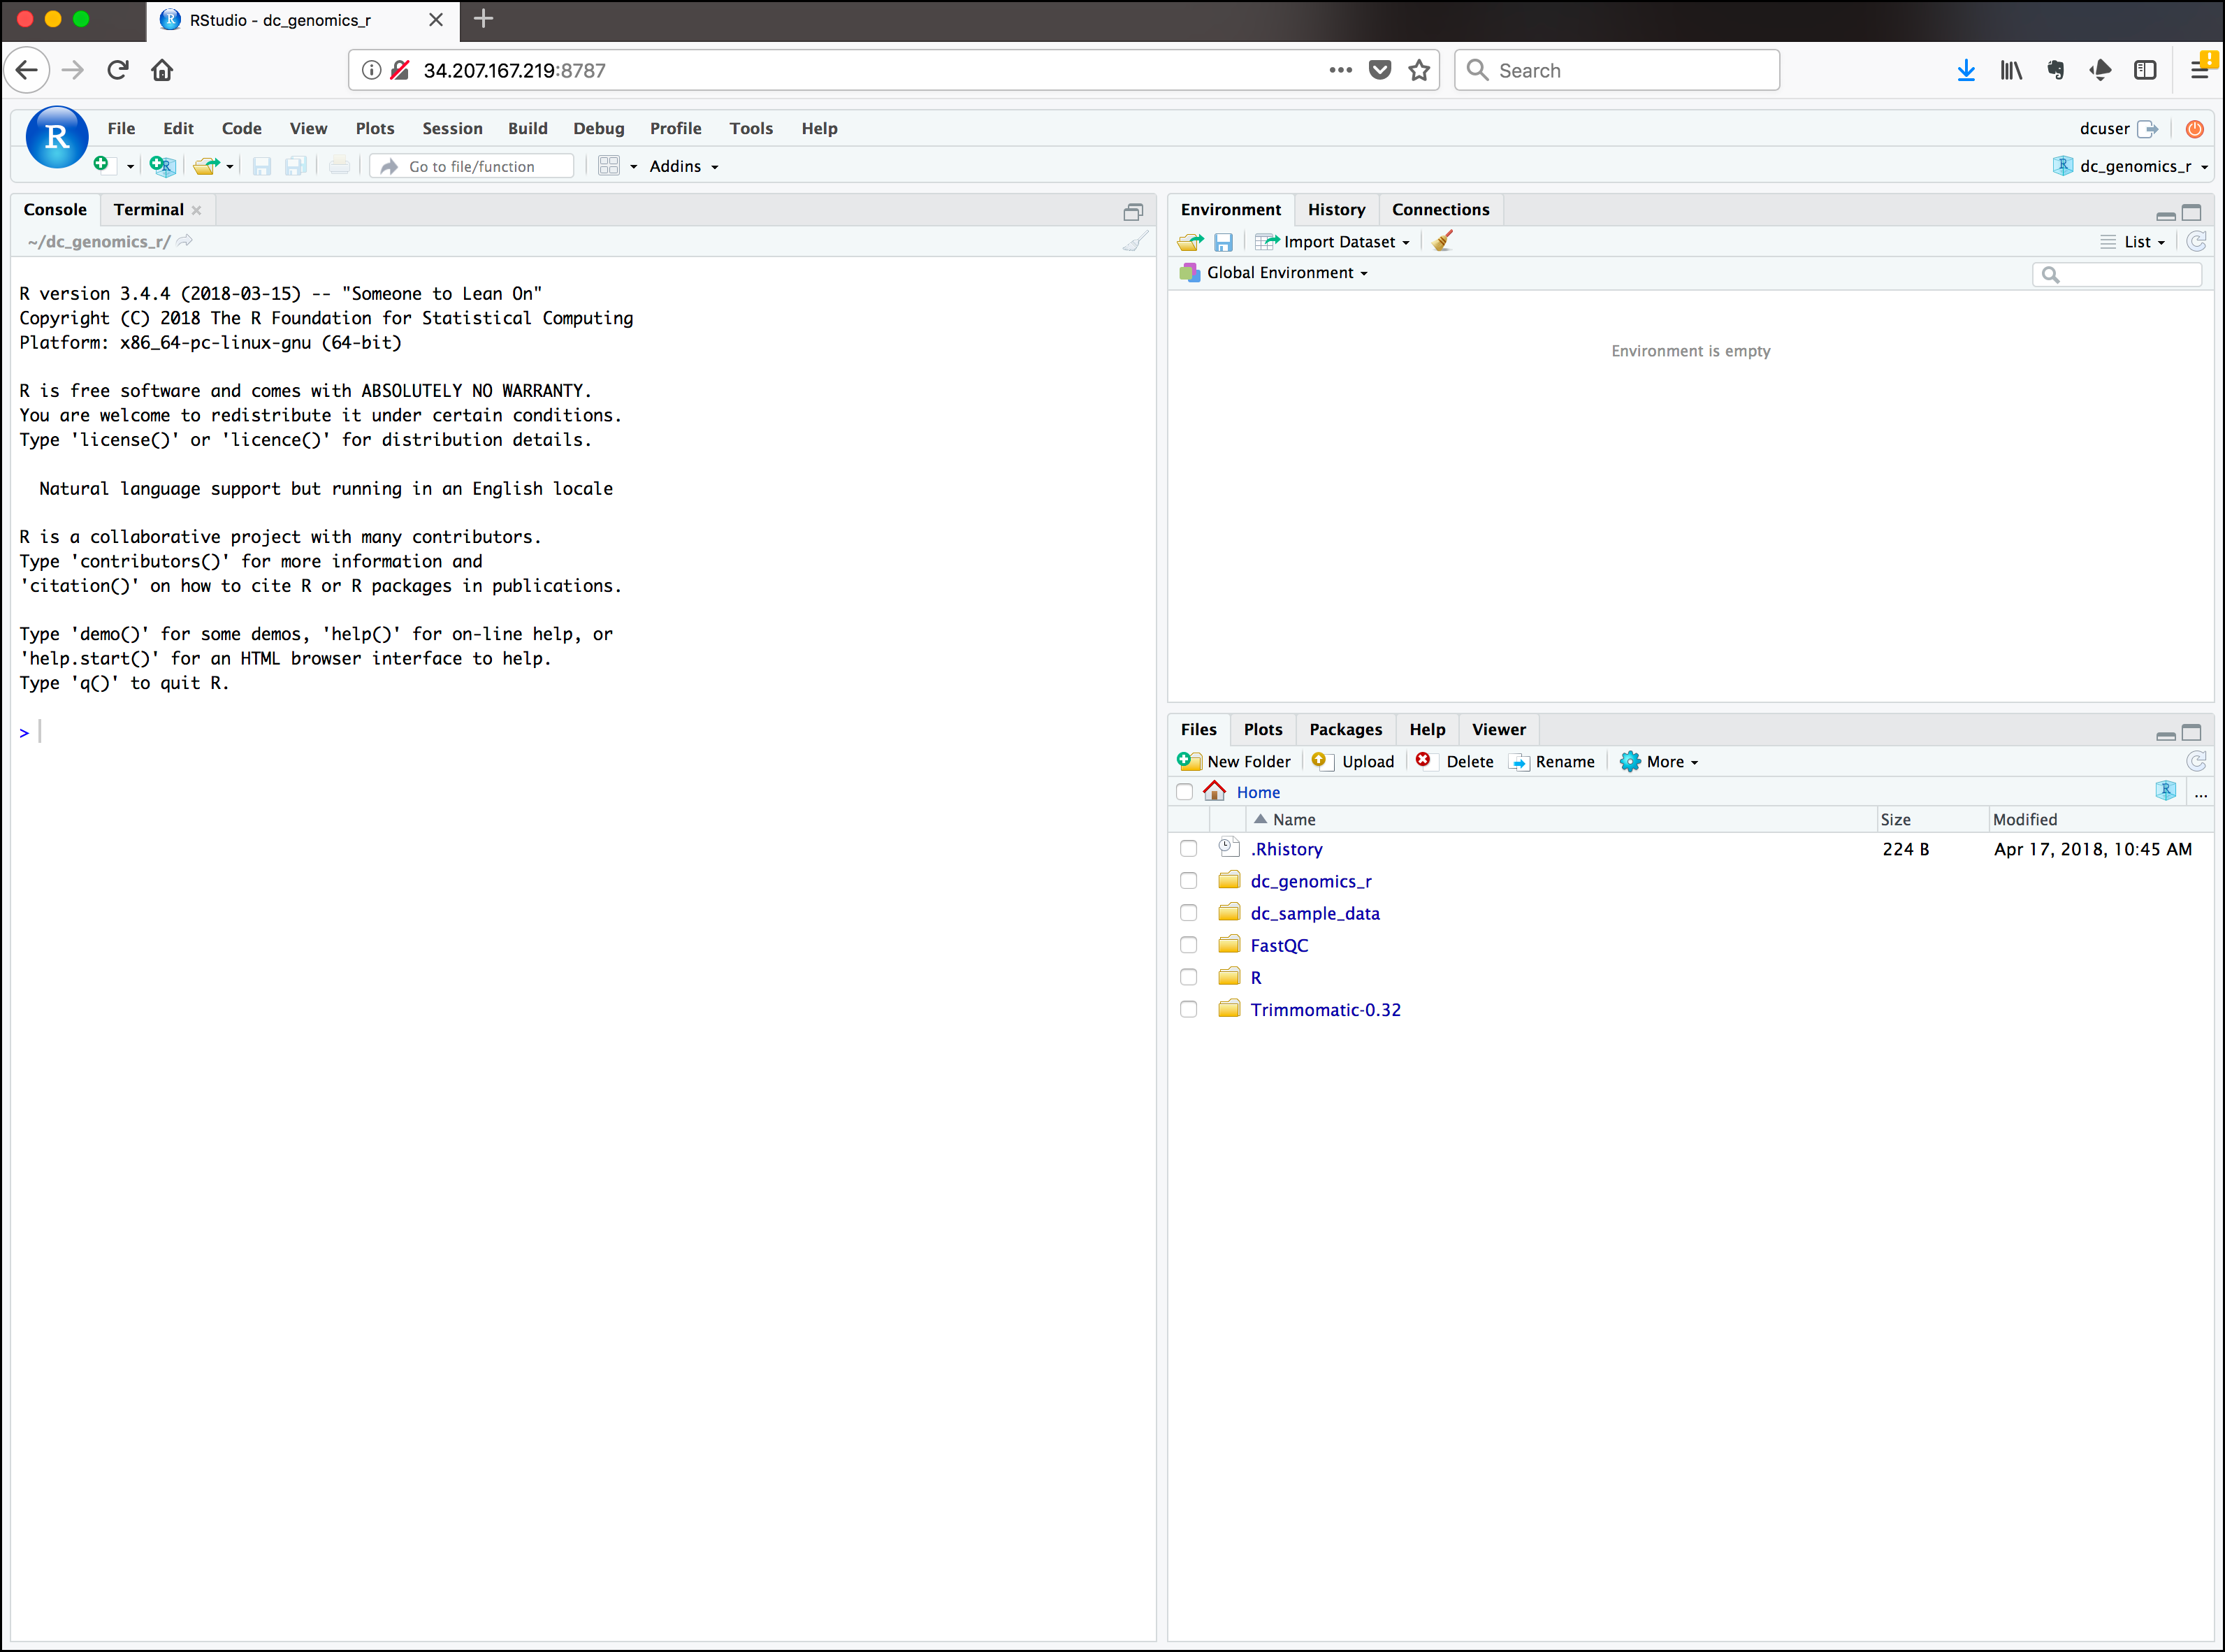
You should now be looking at a page with the RStudio interface:

Creating your first R script
Now that we are ready to start exploring R, we will want to keep a record of the commands we are using. To do this we can create an R script.
Hands-on: Create a R script
- Click the File menu
- Select New File
- Click on R Script
A new panel appears on the top left. Before we go any further, you should save your script.
Hands-on: Save a R script
Click the galaxy-save icon (Save current document) in the bar above the first line in the script editor
Alternatively, you can also:
- Click the File menu and select Save
- Type CTRL+S (CMD+S on OSX)
In the Save File window that opens, name your file
genomics_r_basics
The new script genomics_r_basics.R should appear under Files in the bottom right panel. By convention, R scripts end with the file extension .R.
Overview and customization of the RStudio layout
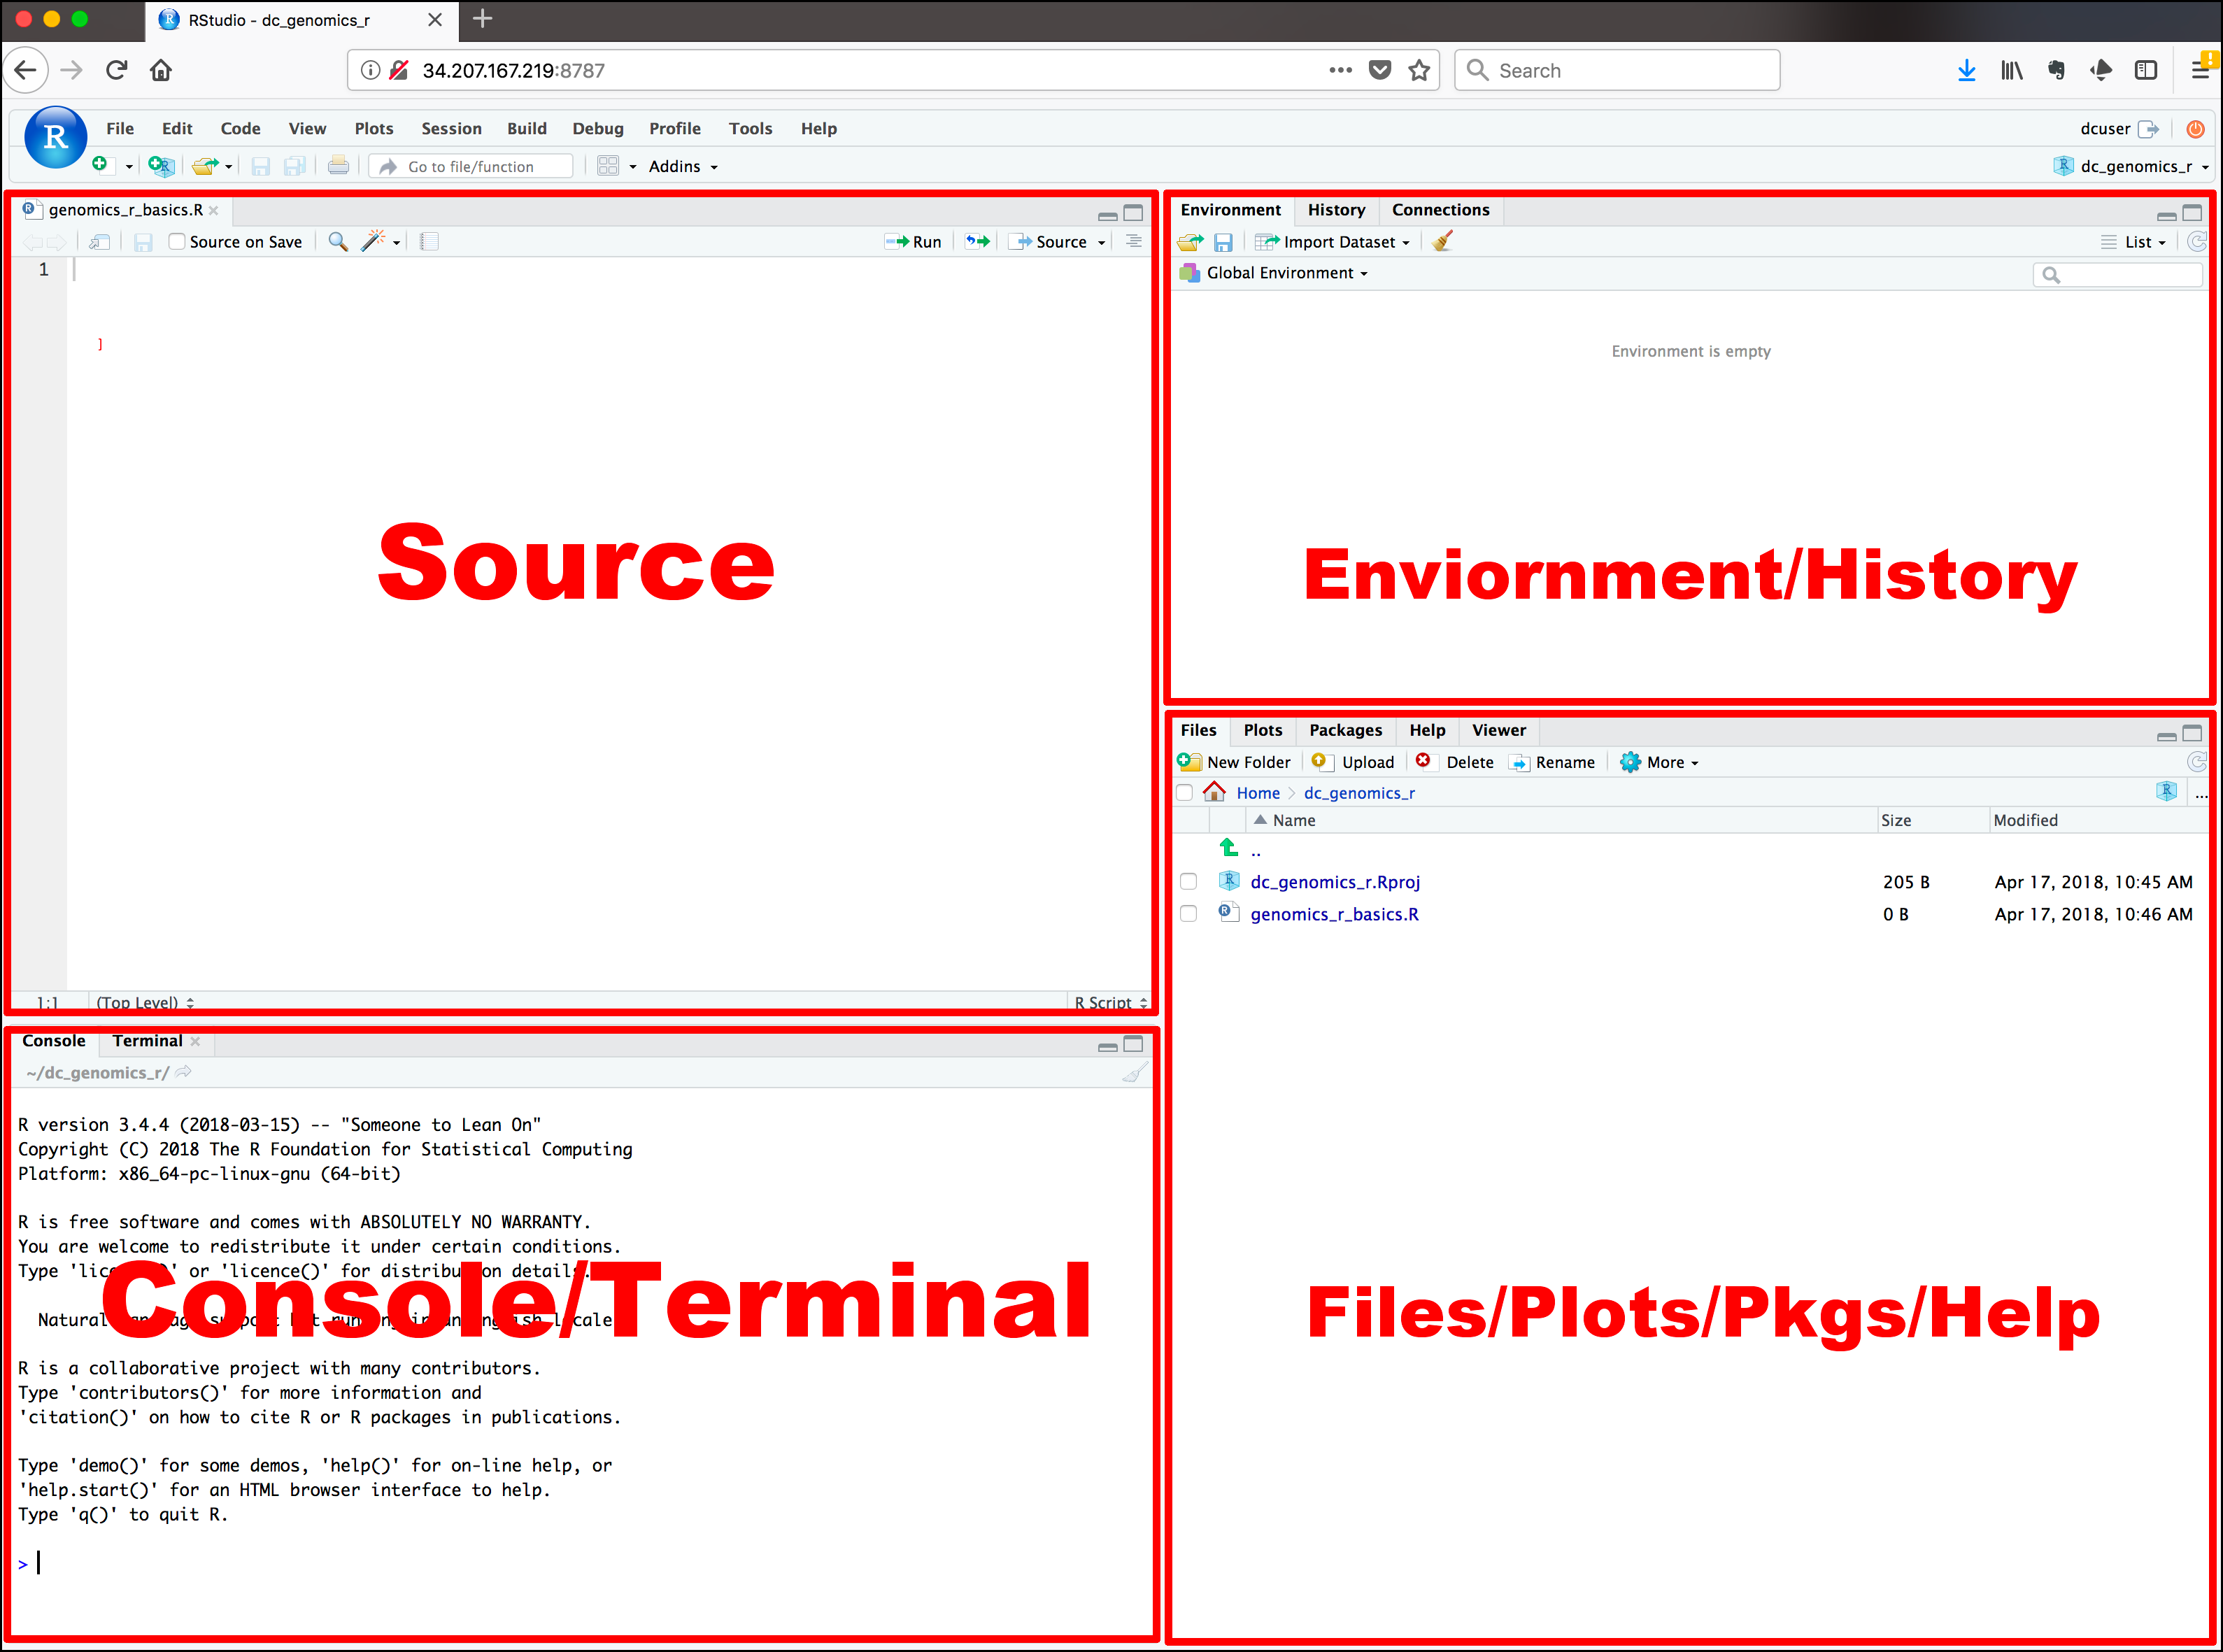
Here are the major windows (or panels) of the RStudio environment:

-
Source: This panel is where you will write/view R scripts
Some outputs (such as if you view a dataset using
View()) will appear as a tab here. -
Console/Terminal: This is actually where you see the execution of commands
This is the same display you would see if you were using R at the command line without RStudio. You can work interactively (i.e. enter R commands here), but for the most part we will run a script (or lines in a script) in the source pane and watch their execution and output here.
-
Environment/History: RStudio will show here you what datasets and objects (variables) you have created and which are defined in memory.
You can also see some properties of objects/datasets such as their type and dimensions. The History tab contains a history of the R commands you’ve executed in R.
-
Files/Plots/Packages/Help: This multipurpose panel will show you the contents of directories on your computer
- Files: You can also use this tab to navigate and set the working directory
- Plots: This tab will show the output of any plots generated
- Package: In this tab you will see what packages are actively loaded, or you can attach installed packages
- Help: It will display help files for R functions and packages.
All of the panels in RStudio have configuration options. For example, you can minimize/maximize a panel, or by moving your mouse in the space between panels you can resize as needed. The most important customization options for panel layout are in the View menu. Other options such as font sizes, colors/themes, and more are in the Tools menu under Global Options.
Comment: Working with R at the terminalAlthough we won’t be working with R at the terminal, there are lots of reasons to.
For example, once you have written an RScript, you can run it at any Linux or Windows terminal without the need to start up RStudio. We don’t want you to get confused - RStudio runs R, but R is not RStudio.
For more on running an R Script at the terminal see the dedicated Software Carpentry lesson.
How to call functions in R, without needing to master them?
A function in R (or any computing language) is a short program that takes some input and returns some output.
Hands-on: Calling a function in R
- Type
date()in the Console panel- Type Enter
- Check what is displayed in the Console panel
You should obtain something like:
[1] "Tue Mar 26 15:12:24 2019"
Comment: Display of function call in the tutorialNow in the tutorial, we will display the function call like this:
> date()
[1] "Tue Mar 26 15:12:24 2019"
The other way to execute these functions is to use the script we just created and then keep track of the functions.
Hands-on: Running a function via a script
- Type
date()in the Script panel- Click on the Run the current line or selection or type CTRL+Enter (or CMD+Enter)
You should see in the Console panel the same as when we run the function directly via the console.
We would like now to keep information about this function
Hands-on: Comment in a script
Write on the line before
date()a comment:# Gives the current date- Select both lines
- Execute them
- Check the output
The comment line is displayed in the console but not executed.
Question: What do these functions do?Try the following functions by writing them in your script. See if you can guess what they do, and make sure to add comments to your script about your assumed purpose.
dir()sessionInfo()Sys.time()
dir()lists files in the working directorysessionInfo()gives the version of R and additional info including on attached packagesSys.time()gives the current time
Warning: Commands are case sensitive!In R, the commands are case sensitive. So be careful when you type them.
You have hopefully noticed a pattern - an R function has three key properties:
- A name (e.g.
dir,getwd) first - A pair of
()after the name -
0 or more arguments inside the parentheses
An argument may be a specific input for your function and/or may modify the function’s behavior. For example the function
round()will round a number with a decimal:# This will round a number to the nearest integer > round(3.14) [1] 3
Getting help
What if you wanted to round to one significant digit, round() can do this, but you may first need to read the help to find out how.
To see the help you need enter a ? in front of the function name. The Help tab (in the bottom-right panel) will show you information.
Hands-on: Get help
Add a
?in front of the function name to see the help> ?round()Check the Help tab
In R, this help is sometimes also called a “vignette”. Often there is too much information. You will slowly learn how to read and make sense of them:
- Checking the Usage or Examples headings is often a good place to look first
- Under Arguments, we can also see what arguments we can pass to this function to modify its behavior
We can also see the arguments of a function without opening its help.
Hands-on: Get the function arguments
Type
args()to see the arguments ofroundfunction> args(round) function (x, digits = 0) NULL
round() takes two arguments:
x: the number to be rounded-
digits: integer indicating the number of decimal places to be usedThe
=sign indicates that a default (in this case 0) is already set.
Since x is not set, round() requires we provide it, in contrast to digits where R will use the default value 0 unless you explicitly provide a different value.
We can explicitly set the digits parameter when we call the function.
Hands-on: Call a function with several parameters
- Call
roundwith 2 arguments
- x:
3.14159- digits:
2> round(3.14159, digits = 2) [1] 3.14- Call
roundwith 2 arguments
- 3.14159
- 2
> round(3.14159, 2)
[1] 3.14
R accepts what we call “positional arguments”. If you pass a function arguments separated by commas, R assumes that they are in the order you saw when we used args(). In the case below that means that x is 3.14159 and digits is 2.
Finally, what if you are using ? to get help for a function in a package not installed on your system, such as when you are running a script which has dependencies?
Hands-on: Get help for a missing function
- Ask help for
geom_point()Check the generated error
> ?geom_point() Error in .helpForCall(topicExpr, parent.frame()) : no methods for ‘geom_point’ and no documentation for it as a function- Type
??geom_point()- Check the Help tab
Using the two question marks (here ??geom_point()), R returns results from a search of the documentation for packages you have installed on your computer in the Help tab.
Finally, if you think there should be a function, for example a statistical test, but you aren’t sure what it is called in R, or what functions may be available.
Hands-on: Search for a function
- Type
help.search('chi-Squared test')- Check the Help panel
A list of potential interesting function related to “chi-Squared test” are listed. You can click on one of them to see the help of it. Remember to put your search query in quotes inside the function’s parentheses.
Question: Search for R functionsSearch the R functions for the following statistical functions
- Student-t test
- mixed linear model
While your search results may return several tests, we list a few you might find:
- Student-t test:
stats::TDist- mixed linear model:
stats::lm.glm
We will not discuss now, where to look for the libraries and packages that contain functions you want to use. For now, be aware that two important ones are:
- CRAN: the main repository for R
- Bioconductor: a popular repository for bioinformatics-related R packages
RStudio contextual help
Here is one last bonus we will mention about RStudio. It’s difficult to remember all of the arguments and definitions associated with a given function.
Hands-on: Search for a function
- Type
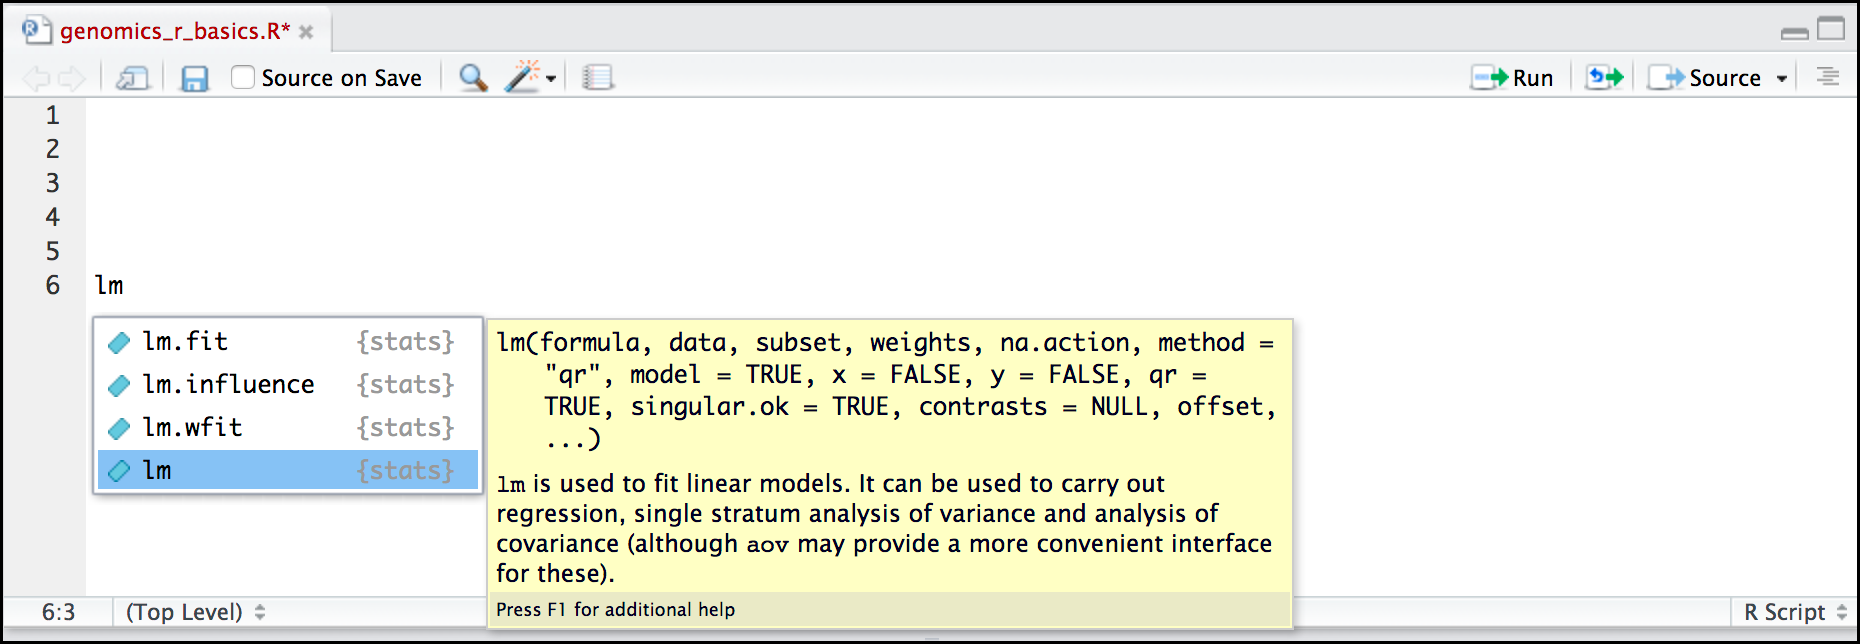
lmin the Script panelHit Tab
RStudio displays functions and associated help
- Select
lmfunction using the arrows- Hit Enter
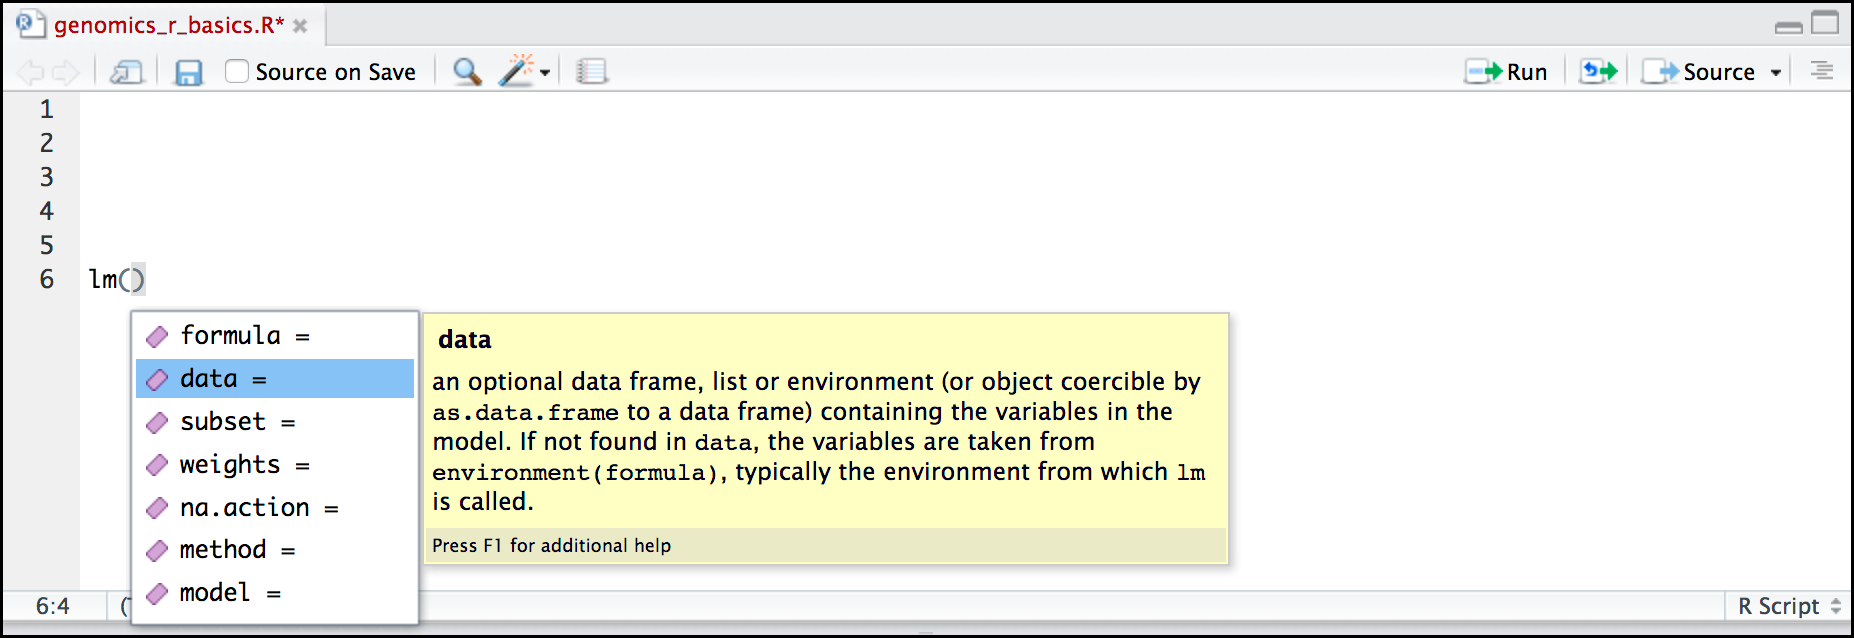
Hit Tab again inside the parantheses
RStudio shows the function’s arguments and provide additional help for each of these arguments:
Stopping RStudio
RStudio will keep running until you stop it, so you can always come back to your analysis later. However, once you are finished with your analysis, you should save the work you did within RStudio by exporting any files you created back to your Galaxy history, as well as the log describing all the commands you ran. Then you can safely shut down RStudio.
Hands-on: Stop RStudioWhen you have finished your R analysis, it’s time to stop RStudio.
- First, save your work into Galaxy, to ensure reproducibility:
- You can use
gx_put(filename)to save individual files by supplying the filename- You can use
gx_save()to save the entire analysis transcript and any data objects loaded into your environment.- Once you have saved your data, you can proceed in 2 different ways:
- Deleting the corresponding history dataset named
RStudioand showing a “in progress state”, so yellow, OR- Clicking on the “User” menu at the top and go to “Active InteractiveTools” and locate the RStudio instance you started, selecting the corresponding box, and finally clicking on the “Stop” button at the bottom.
Interaction between RStudio and Galaxy
Getting data in and out from Galaxy
Conclusion
Key points
Why it’s helpful to be able to work with R interactively within Galaxy
Frequently Asked Questions
Have questions about this tutorial? Check out the FAQ page for the Using Galaxy and Managing your Data topic to see if your question is listed there. If not, please ask your question on the GTN Gitter Channel or the Galaxy Help ForumFeedback
Did you use this material as an instructor? Feel free to give us feedback on how it went.
Did you use this material as a learner or student? Click the form below to leave feedback.
Citing this Tutorial
- Bérénice Batut, Fotis E. Psomopoulos, Toby Hodges, Erasmus+ Programme, 2022 RStudio in Galaxy (Galaxy Training Materials). https://training.galaxyproject.org/training-material/topics/galaxy-interface/tutorials/rstudio/tutorial.html Online; accessed TODAY
- Batut et al., 2018 Community-Driven Data Analysis Training for Biology Cell Systems 10.1016/j.cels.2018.05.012
Congratulations on successfully completing this tutorial!@misc{galaxy-interface-rstudio, author = "Bérénice Batut and Fotis E. Psomopoulos and Toby Hodges and Erasmus+ Programme", title = "RStudio in Galaxy (Galaxy Training Materials)", year = "2022", month = "10", day = "18" url = "\url{https://training.galaxyproject.org/training-material/topics/galaxy-interface/tutorials/rstudio/tutorial.html}", note = "[Online; accessed TODAY]" } @article{Batut_2018, doi = {10.1016/j.cels.2018.05.012}, url = {https://doi.org/10.1016%2Fj.cels.2018.05.012}, year = 2018, month = {jun}, publisher = {Elsevier {BV}}, volume = {6}, number = {6}, pages = {752--758.e1}, author = {B{\'{e}}r{\'{e}}nice Batut and Saskia Hiltemann and Andrea Bagnacani and Dannon Baker and Vivek Bhardwaj and Clemens Blank and Anthony Bretaudeau and Loraine Brillet-Gu{\'{e}}guen and Martin {\v{C}}ech and John Chilton and Dave Clements and Olivia Doppelt-Azeroual and Anika Erxleben and Mallory Ann Freeberg and Simon Gladman and Youri Hoogstrate and Hans-Rudolf Hotz and Torsten Houwaart and Pratik Jagtap and Delphine Larivi{\`{e}}re and Gildas Le Corguill{\'{e}} and Thomas Manke and Fabien Mareuil and Fidel Ram{\'{\i}}rez and Devon Ryan and Florian Christoph Sigloch and Nicola Soranzo and Joachim Wolff and Pavankumar Videm and Markus Wolfien and Aisanjiang Wubuli and Dilmurat Yusuf and James Taylor and Rolf Backofen and Anton Nekrutenko and Björn Grüning}, title = {Community-Driven Data Analysis Training for Biology}, journal = {Cell Systems} }
Do you want to extend your knowledge? Follow one of our recommended follow-up trainings:
- Foundations of Data Science
- R basics in Galaxy: tutorial hands-on

 Questions:


