name: inverse layout: true class: center, middle, inverse <div class="my-header"><span> <a href="/training-material/topics/transcriptomics" title="Return to topic page" ><i class="fa fa-level-up" aria-hidden="true"></i></a> <a class="nav-link" href="https://github.com/galaxyproject/training-material/edit/main/topics/transcriptomics/slides/introduction.html"><i class="fa fa-pencil" aria-hidden="true"></i></a> </span></div> <div class="my-footer"><span> <img src="/training-material/assets/images/GTN-60px.png" alt="Galaxy Training Network" style="height: 40px;"/> </span></div> --- <img src="/training-material/assets/images/GTN.png" alt="Galaxy Training Network" class="cover-logo"/> # Introduction to Transcriptomics <div markdown="0"> <div class="contributors-line"> Authors: <a href="/training-material/hall-of-fame/bebatut/" class="contributor-badge contributor-bebatut"><img src="/training-material/assets/images/orcid.png" alt="orcid logo"/><img src="https://avatars.githubusercontent.com/bebatut?s=27" alt="Avatar">Bérénice Batut</a> <a href="/training-material/hall-of-fame/erxleben/" class="contributor-badge contributor-erxleben"><img src="/training-material/assets/images/orcid.png" alt="orcid logo"/><img src="https://avatars.githubusercontent.com/erxleben?s=27" alt="Avatar">Anika Erxleben</a> <a href="/training-material/hall-of-fame/mwolfien/" class="contributor-badge contributor-mwolfien"><img src="https://avatars.githubusercontent.com/mwolfien?s=27" alt="Avatar">Markus Wolfien</a> </div> </div> <!-- modified date --> <div class="footnote" style="bottom: 8em;"><i class="far fa-calendar" aria-hidden="true"></i><span class="visually-hidden">last_modification</span> Updated: Dec 20, 2021</div> <!-- other slide formats (video and plain-text) --> <div class="footnote" style="bottom: 6em;"> <i class="fas fa-file-alt" aria-hidden="true"></i><span class="visually-hidden">text-document</span><a href="slides-plain.html"> Plain-text slides</a> </div> <!-- usage tips --> <div class="footnote" style="bottom: 2em;"> <strong>Tip: </strong>press <kbd>P</kbd> to view the presenter notes | <i class="fa fa-arrows" aria-hidden="true"></i><span class="visually-hidden">arrow-keys</span> Use arrow keys to move between slides </div> ??? Presenter notes contain extra information which might be useful if you intend to use these slides for teaching. Press `P` again to switch presenter notes off Press `C` to create a new window where the same presentation will be displayed. This window is linked to the main window. Changing slides on one will cause the slide to change on the other. Useful when presenting. --- ## Requirements Before diving into this slide deck, we recommend you to have a look at: - [Introduction to Galaxy Analyses](/training-material/topics/introduction) - [Sequence analysis](/training-material/topics/sequence-analysis) - Quality Control: [<i class="fab fa-slideshare" aria-hidden="true"></i><span class="visually-hidden">slides</span> slides](/training-material/topics/sequence-analysis/tutorials/quality-control/slides.html) - [<i class="fas fa-laptop" aria-hidden="true"></i><span class="visually-hidden">tutorial</span> hands-on](/training-material/topics/sequence-analysis/tutorials/quality-control/tutorial.html) - Mapping: [<i class="fab fa-slideshare" aria-hidden="true"></i><span class="visually-hidden">slides</span> slides](/training-material/topics/sequence-analysis/tutorials/mapping/slides.html) - [<i class="fas fa-laptop" aria-hidden="true"></i><span class="visually-hidden">tutorial</span> hands-on](/training-material/topics/sequence-analysis/tutorials/mapping/tutorial.html) --- # What is RNA sequencing? --- ### RNA  - Transcribed form of the DNA - Active state of the DNA .footnote[[Credit: Thomas Shafee](https://en.wikipedia.org/wiki/File:Gene_structure_eukaryote_2_annotated.svg)] --- ## RNA sequencing  - RNA quantification at single base resolution - Cost efficient analysis of the whole transcriptome in a high-throughput manner .footnote[[Credit: Thomas Shafee (adapted)](https://commons.wikimedia.org/wiki/File:Summary_of_RNA-Seq.svg)] --- ### Where does my data come from?  .footnote[[*Zang and Mortazavi, Nature, 2012*](https://www.ncbi.nlm.nih.gov/pmc/articles/PMC4138050/)] --- ### Principle of RNA sequencing  .footnote[[*Korf, Nat Met, 2013*](https://www.ncbi.nlm.nih.gov/pmc/articles/PMC4461013/)] --- ### Challenges of RNA sequencing - Different origin for the sample RNA and the reference genome - Presence of incompletely processed RNAs or transcriptional background noise - Sequencing biases (*e.g.* PCR library preparation) --- ### Benefits of RNA sequencing  --- ### 2 main research applications for RNA-Seq - Transcript discovery > *Which RNA molecules are in my sample?* > Novel isoforms and alternative splicing, Non-coding RNAs, Single nucleotide variations, Fusion genes - RNA quantification > *What is the concentration of RNAs?* > Absolute gene expression (within sample), Differential expression (between biological samples) --- ## How to analyze RNA seq data for RNA quantification? --- ### RNA quantification 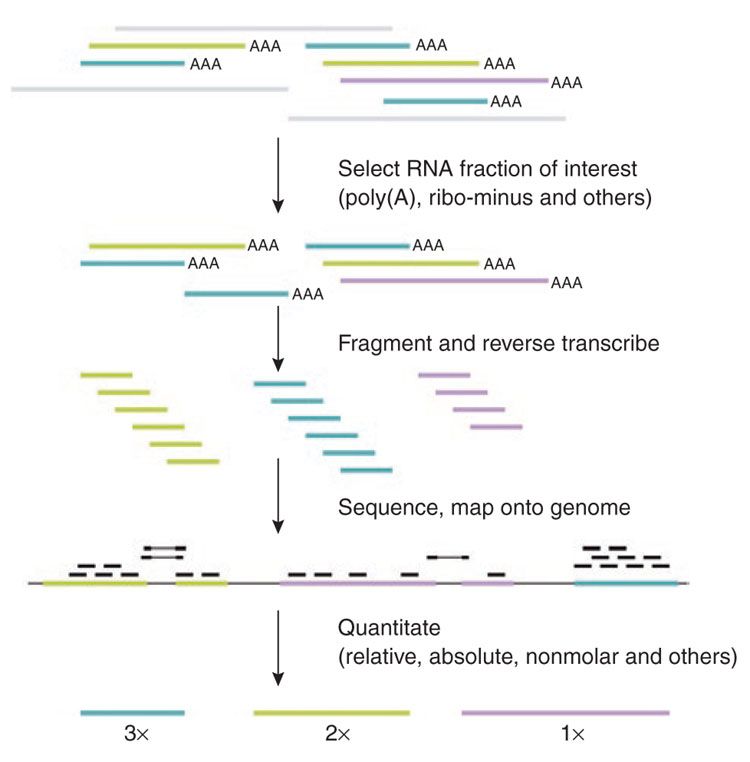 .footnote[[*Pepke et al, Nat Met, 2009*](https://www.ncbi.nlm.nih.gov/pmc/articles/PMC4077321/)] --- ### Overview of the Data Processing  - No available standardized workflow - Multiple possible best practices for every dataset --- ### Data Pre-processing 1. Adapter clipping to trim the sequencing adapters 2. Quality trimming to remove wrongly called and low quality bases .footnote[See [NGS Quality control](/training-material/topics/sequence-analysis/tutorials/quality-control/slides.html)] --- ### Annotation of RNA-Seq reads Simple mapping on a reference genome? More challenging 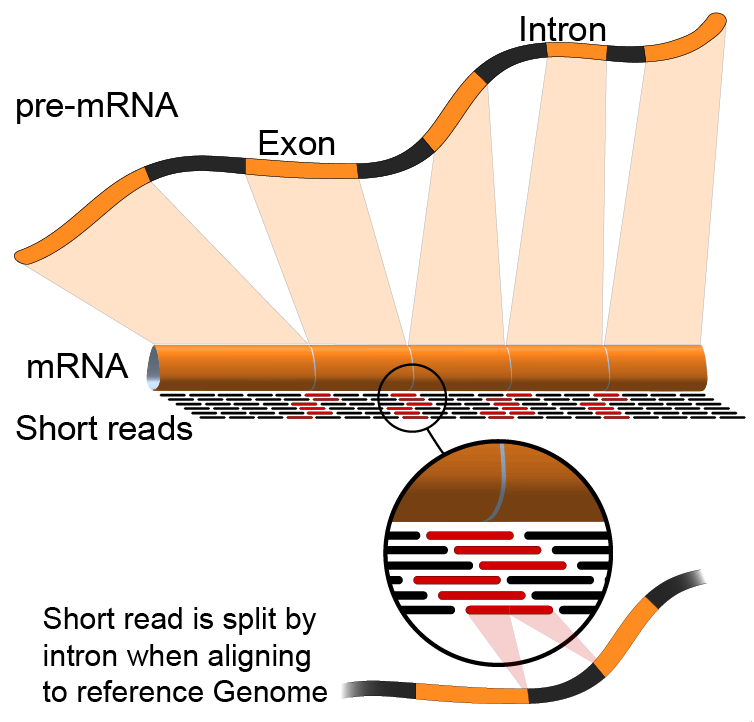 .footnote[[Credit: Rgocs](https://en.wikipedia.org/wiki/File:RNA-Seq-alignment.png)] --- ### Annotation of RNA-Seq reads 3 main strategies for annotations - Transcriptome mapping - Genome mapping - *De novo* transcriptome assembly and annotation --- ### Transcriptome mapping 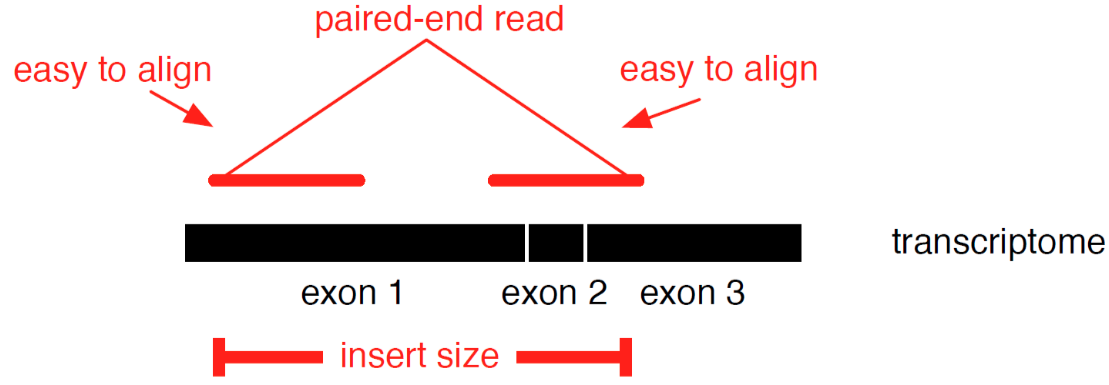 *See [NGS Mapping](/training-material/topics/sequence-analysis/tutorials/mapping/slides.html)* - Need reliable gene models - No detection of novel genes .footnote[Figures by Ernest Turro, EMBO Practical Course on Analysis of HTS Data, 2012] --- ### Genome mapping Splice-aware read alignment  Detection of novel genes and isoforms .footnote[Figures by Ernest Turro, EMBO Practical Course on Analysis of HTS Data, 2012] --- ### Transcriptome and Genome mapping Needed - Reference genome/transcriptome in FASTA - Annotations of known genes, ... in GTF Where to find? - Joint projects to produce and maintain annotations on selected organisms: EMBL-EBI, UCSC, RefSeq, Ensembl, ... --- ### *De novo* transcriptome assembly No need for a reference genome ... 1. Assembly into transcripts 2. Map reads back --- ### Quantification *What is the expression level of the genomic features?* - Counting the number of reads per features: Easy!! - Challenges - How to handle multi-mapped reads (*i.e.* reads with multiple alignments)? - How to distinguish between different isoforms? - At gene level? - At transcript level? - At exon level? --- ### Differential Expression Analysis .image-75[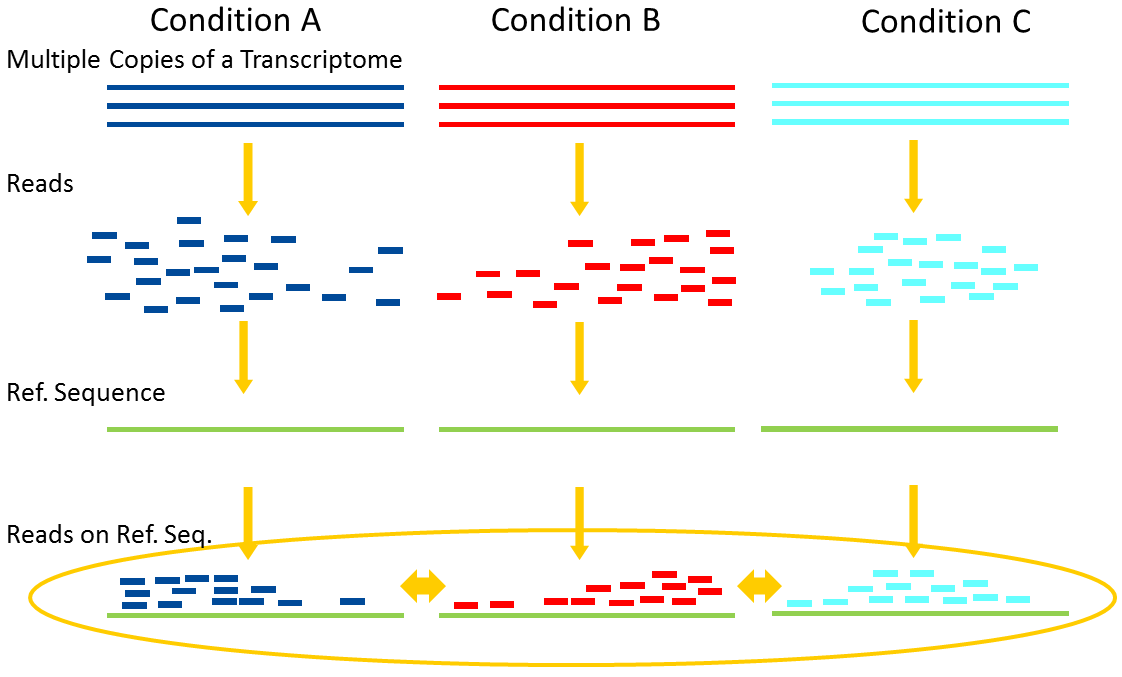] Account for variability of expression across biological replicates<br>with the help of counts --- ### Differential Expression Analysis: Normalization *Make the expression levels comparable across* - By Features: genes, isoforms - By Samples - Methods - [*FPKM/RPKM*](https://www.nature.com/nmeth/journal/v5/n7/abs/nmeth.1226.html) (Cufflinks/Cuffdiff) - [*TMM*](https://genomebiology.biomedcentral.com/articles/10.1186/gb-2010-11-3-r25) (edgeR) - [*DESeq2*](https://genomebiology.biomedcentral.com/articles/10.1186/s13059-014-0550-8) (DESeq2) .footnote[*"Only the DESeq and TMM normalization methods are robust to the presence of different library sizes and widely different library compositions..."* - Dillies et al., Brief Bioinf, 2013] --- ### Impact of sequencing depth and number of replicates .image-75[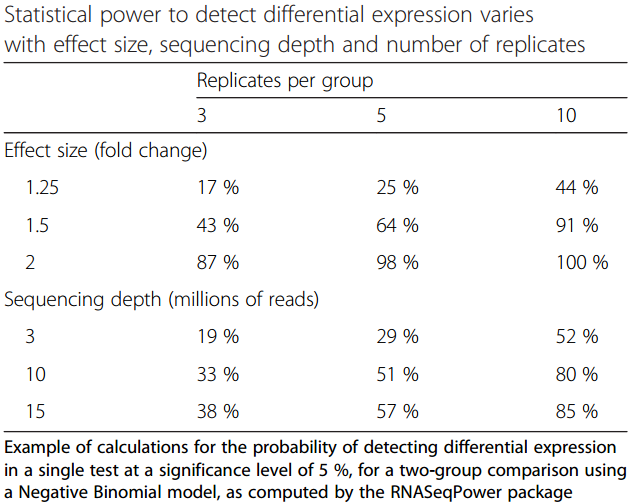] .footnote[[*Conesa et al, Genome Biol, 2016*](https://genomebiology.biomedcentral.com/articles/10.1186/s13059-016-0881-8)] **Recommendation: At least 3 biological replicates** ??? - Number of replicates has greater effect on DE detection accuracy than sequencing depth (more replicates = increased statistical power) - DE detection of lowly expressed genes is very sensitive to number of reads and replication - DE detection of highly expressed genes possible already at low sequencing depth --- ### Visualization - Integrative Genomics Viewer ([*IGV*](https://bib.oxfordjournals.org/content/14/2/178.full?keytype=ref&%2520ijkey=qTgjFwbRBAzRZWC)) or Trackster Visualization of the aligned BAM files - [*Sashimi plots*](https://bioinformatics.oxfordjournals.org/content/early/2015/01/21/bioinformatics.btv034) Quantitative visualization of read coverage along exons and splice junctions - [*CummeRbund*](http://compbio.mit.edu/cummeRbund/manual_2_0.html) Visualization package for Cufflinks high-throughput sequencing data --- ## Related tutorials --- ## Thank You! This material is the result of a collaborative work. Thanks to the [Galaxy Training Network](https://training.galaxyproject.org) and all the contributors! <div markdown="0"> <div class="contributors-line"> Authors: <a href="/training-material/hall-of-fame/bebatut/" class="contributor-badge contributor-bebatut"><img src="/training-material/assets/images/orcid.png" alt="orcid logo"/><img src="https://avatars.githubusercontent.com/bebatut?s=27" alt="Avatar">Bérénice Batut</a> <a href="/training-material/hall-of-fame/erxleben/" class="contributor-badge contributor-erxleben"><img src="/training-material/assets/images/orcid.png" alt="orcid logo"/><img src="https://avatars.githubusercontent.com/erxleben?s=27" alt="Avatar">Anika Erxleben</a> <a href="/training-material/hall-of-fame/mwolfien/" class="contributor-badge contributor-mwolfien"><img src="https://avatars.githubusercontent.com/mwolfien?s=27" alt="Avatar">Markus Wolfien</a> </div> </div> <div style="display: flex;flex-direction: row;align-items: center;justify-content: center;"> <img src="/training-material/assets/images/GTN.png" alt="Galaxy Training Network" style="height: 100px;"/> </div> <a rel="license" href="https://creativecommons.org/licenses/by/4.0/"> This material is licensed under the Creative Commons Attribution 4.0 International License</a>.