Introduction to Transcriptomics
Contributors
What is RNA sequencing?
RNA
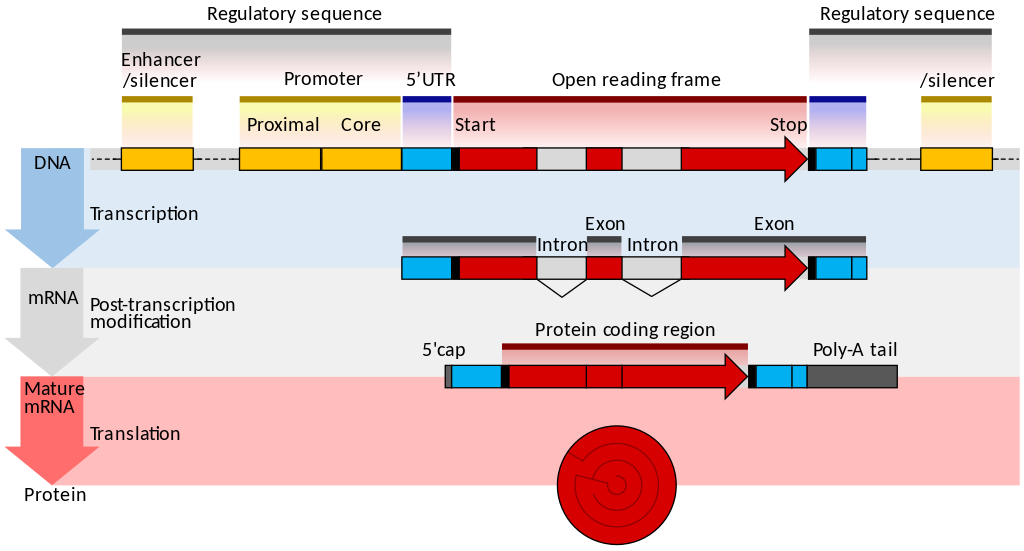
- Transcribed form of the DNA
- Active state of the DNA
.footnote[Credit: Thomas Shafee]
RNA sequencing
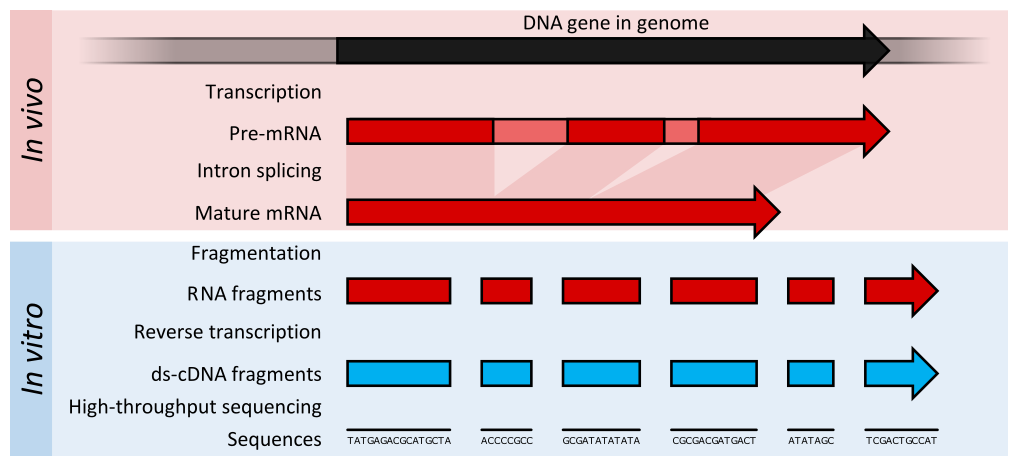
- RNA quantification at single base resolution
- Cost efficient analysis of the whole transcriptome in a high-throughput manner
.footnote[Credit: Thomas Shafee (adapted)]
Where does my data come from?
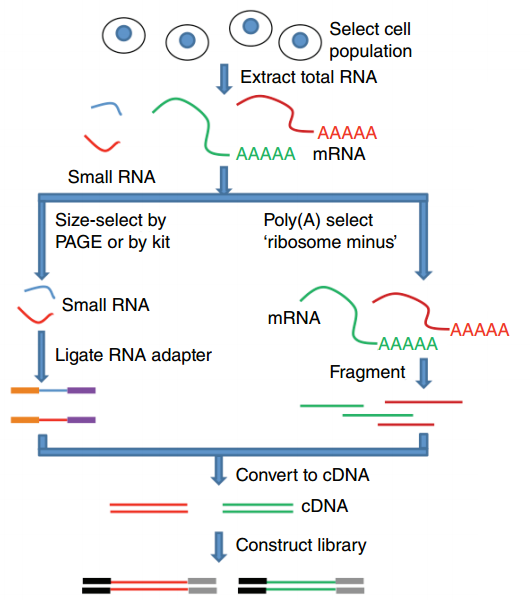
.footnote[Zang and Mortazavi, Nature, 2012]
Principle of RNA sequencing
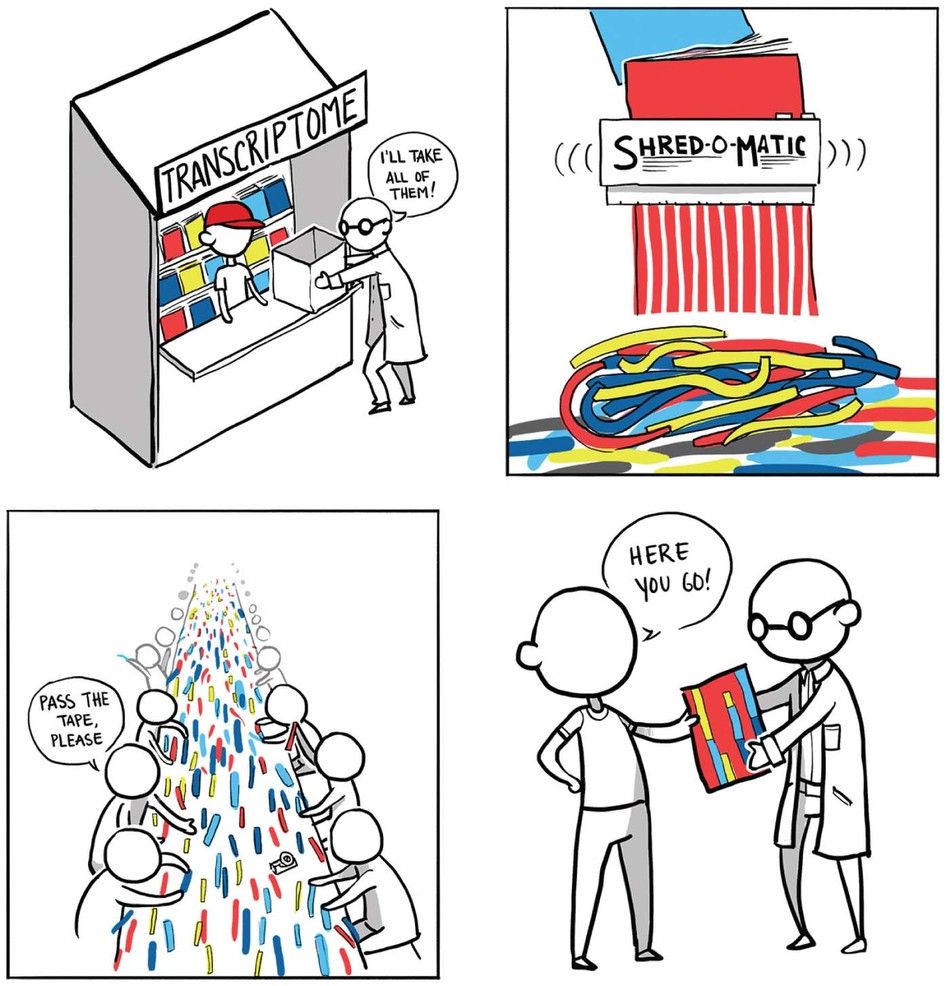
.footnote[Korf, Nat Met, 2013]
Challenges of RNA sequencing
- Different origin for the sample RNA and the reference genome
- Presence of incompletely processed RNAs or transcriptional background noise
- Sequencing biases (e.g. PCR library preparation)
Benefits of RNA sequencing

2 main research applications for RNA-Seq
-
Transcript discovery
Which RNA molecules are in my sample?
Novel isoforms and alternative splicing, Non-coding RNAs, Single nucleotide variations, Fusion genes
-
RNA quantification
What is the concentration of RNAs?
Absolute gene expression (within sample), Differential expression (between biological samples)
How to analyze RNA seq data for RNA quantification?
RNA quantification
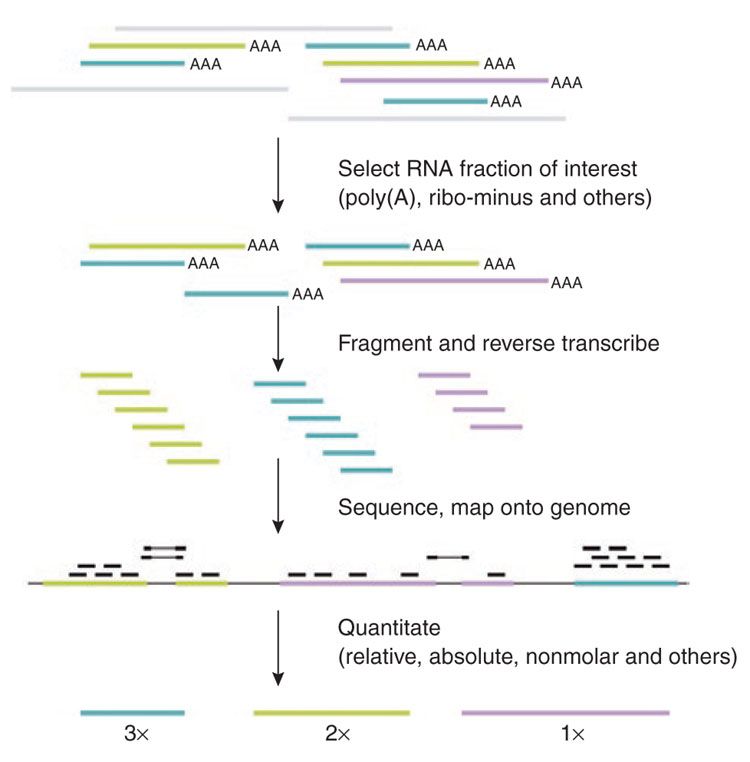
.footnote[Pepke et al, Nat Met, 2009]
Overview of the Data Processing

- No available standardized workflow
- Multiple possible best practices for every dataset
Data Pre-processing
- Adapter clipping to trim the sequencing adapters
- Quality trimming to remove wrongly called and low quality bases
.footnote[See NGS Quality control]
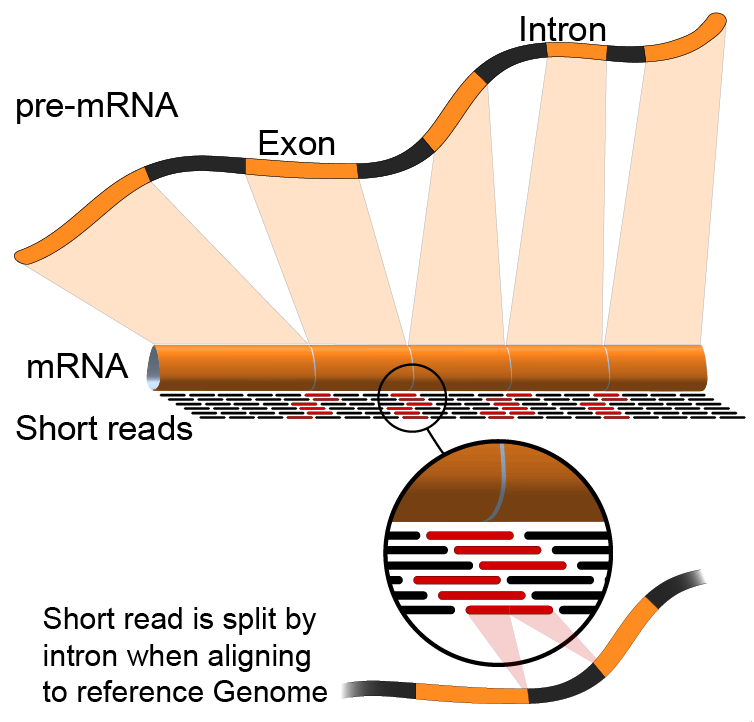
Annotation of RNA-Seq reads
Simple mapping on a reference genome? More challenging
.footnote[Credit: Rgocs]
Annotation of RNA-Seq reads
3 main strategies for annotations
- Transcriptome mapping
- Genome mapping
- De novo transcriptome assembly and annotation
Transcriptome mapping
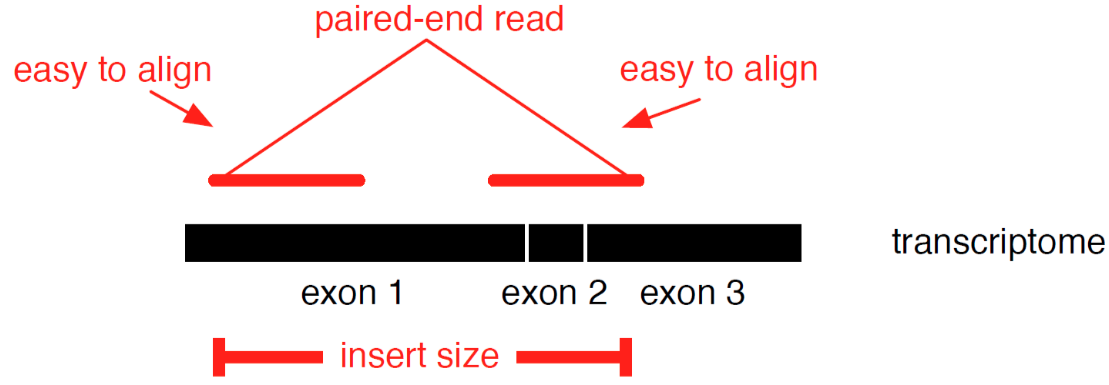
See NGS Mapping
- Need reliable gene models
- No detection of novel genes
.footnote[Figures by Ernest Turro, EMBO Practical Course on Analysis of HTS Data, 2012]
Genome mapping
Splice-aware read alignment

Detection of novel genes and isoforms
.footnote[Figures by Ernest Turro, EMBO Practical Course on Analysis of HTS Data, 2012]
Transcriptome and Genome mapping
Needed
- Reference genome/transcriptome in FASTA
- Annotations of known genes, … in GTF
Where to find?
- Joint projects to produce and maintain annotations on selected organisms: EMBL-EBI, UCSC, RefSeq, Ensembl, …
De novo transcriptome assembly
No need for a reference genome …
- Assembly into transcripts
- Map reads back
Quantification
What is the expression level of the genomic features?
- Counting the number of reads per features: Easy!!
- Challenges
- How to handle multi-mapped reads (i.e. reads with multiple alignments)?
- How to distinguish between different isoforms?
- At gene level?
- At transcript level?
- At exon level?
Differential Expression Analysis
.image-75[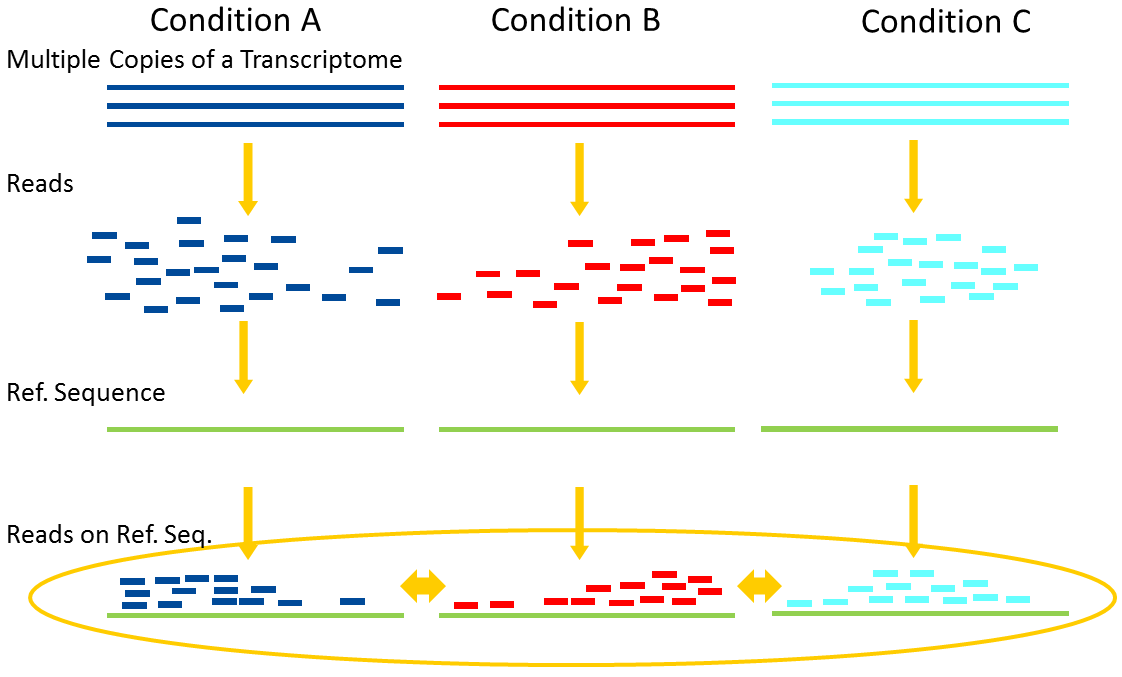 ]
]
Account for variability of expression across biological replicates
with the help of counts
Differential Expression Analysis: Normalization
Make the expression levels comparable across
- By Features: genes, isoforms
- By Samples
- Methods
.footnote[“Only the DESeq and TMM normalization methods are robust to the presence of different library sizes and widely different library compositions…” - Dillies et al., Brief Bioinf, 2013]
Impact of sequencing depth and number of replicates
.image-75[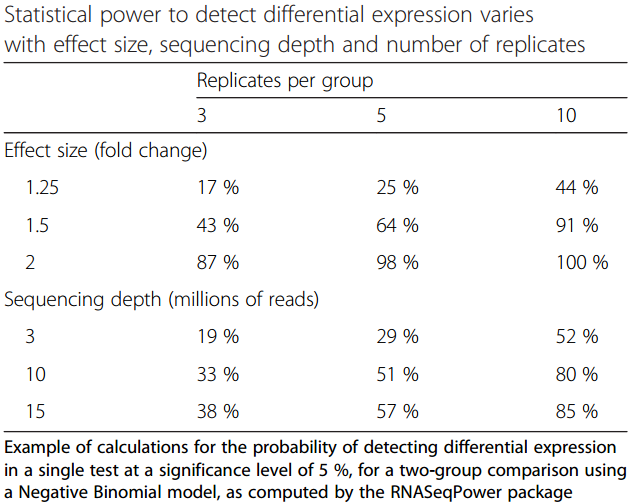 ]
]
.footnote[Conesa et al, Genome Biol, 2016]
Recommendation: At least 3 biological replicates
Speaker Notes
- Number of replicates has greater effect on DE detection accuracy than sequencing depth (more replicates = increased statistical power)
- DE detection of lowly expressed genes is very sensitive to number of reads and replication
- DE detection of highly expressed genes possible already at low sequencing depth
Visualization
-
Integrative Genomics Viewer (IGV) or Trackster
Visualization of the aligned BAM files
-
Quantitative visualization of read coverage along exons and splice junctions
-
Visualization package for Cufflinks high-throughput sequencing data
Thank you!
This material is the result of a collaborative work. Thanks to the Galaxy Training Network and all the contributors! This material is licensed under the Creative Commons Attribution 4.0 International License.
