Clustering 3K PBMCs with Scanpy
Contributors
Questions
What are the main steps of scRNA-seq?
What kind of variation can confound an analysis?
Objectives
Learn the main stages of an scRNA-seq analysis
Understand the methods and concepts underlying scRNA-seq
Single Cell RNA Pre-processing
Speaker Notes
- Barcode Extraction
- Mapping
- Gene Annotation
- Batch count matrices
Single Cell RNA Downstream Analysis
Speaker Notes
- Filtering
- Normalising
- Confounder Removal
- Dimension Reduction
- Clustering
- Annotation
Barcoding Cells
Filtering: Cell and Gene
Normalisation: Technical Variation
Normalisation: Biological Variation
Dimension Reduction: Relatedness of Cells
Speaker Notes Build a KNN graph from distance matrix:
- If P and q share distance which is
Dimension Reduction: Projection
Speaker Notes
- Can use tSNE, PCA, UMAP
Community Clustering: Louvain
Aim: Maximise internal links and minimise external links
Community Clustering: Louvain
Pick a cell, place in neighbour, and accept if internal:external increases
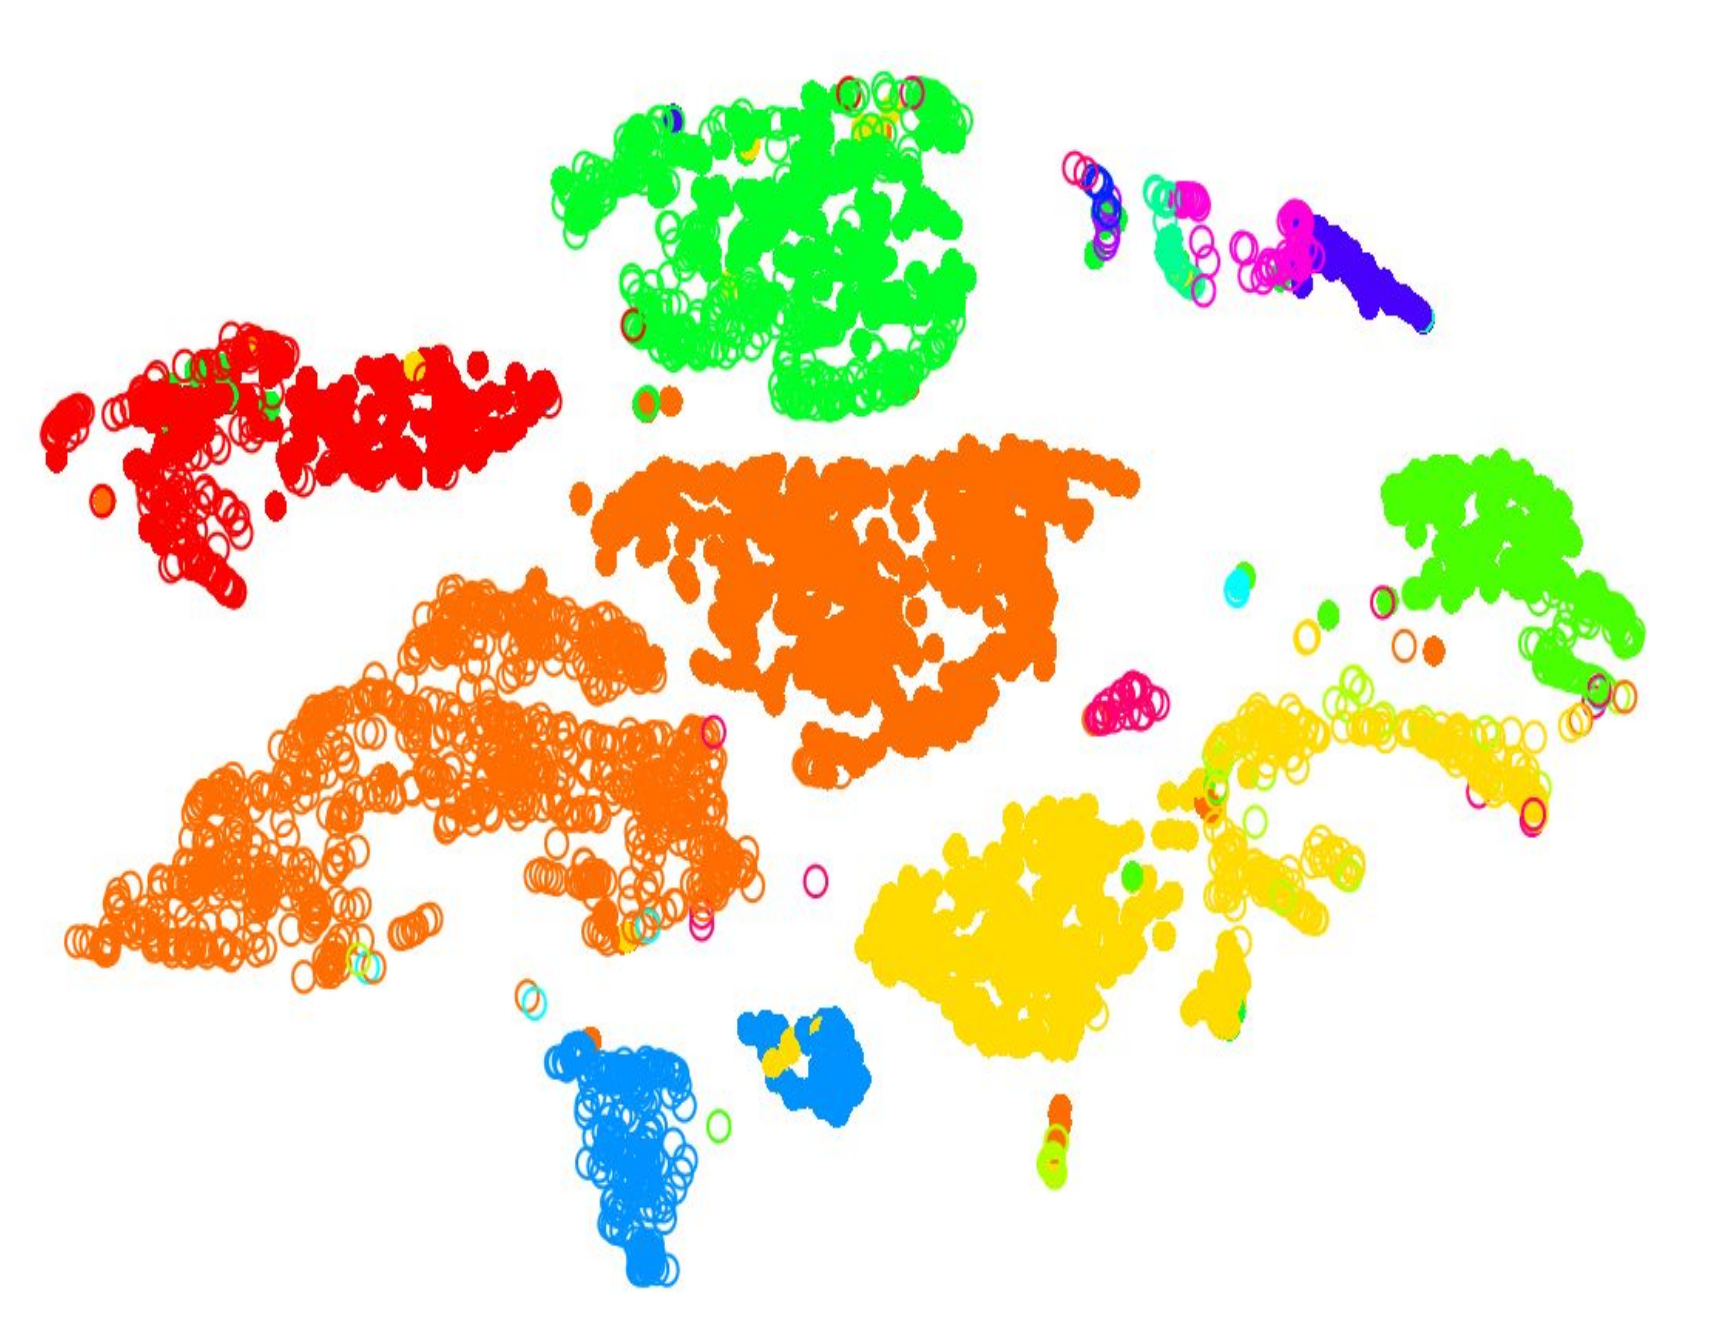
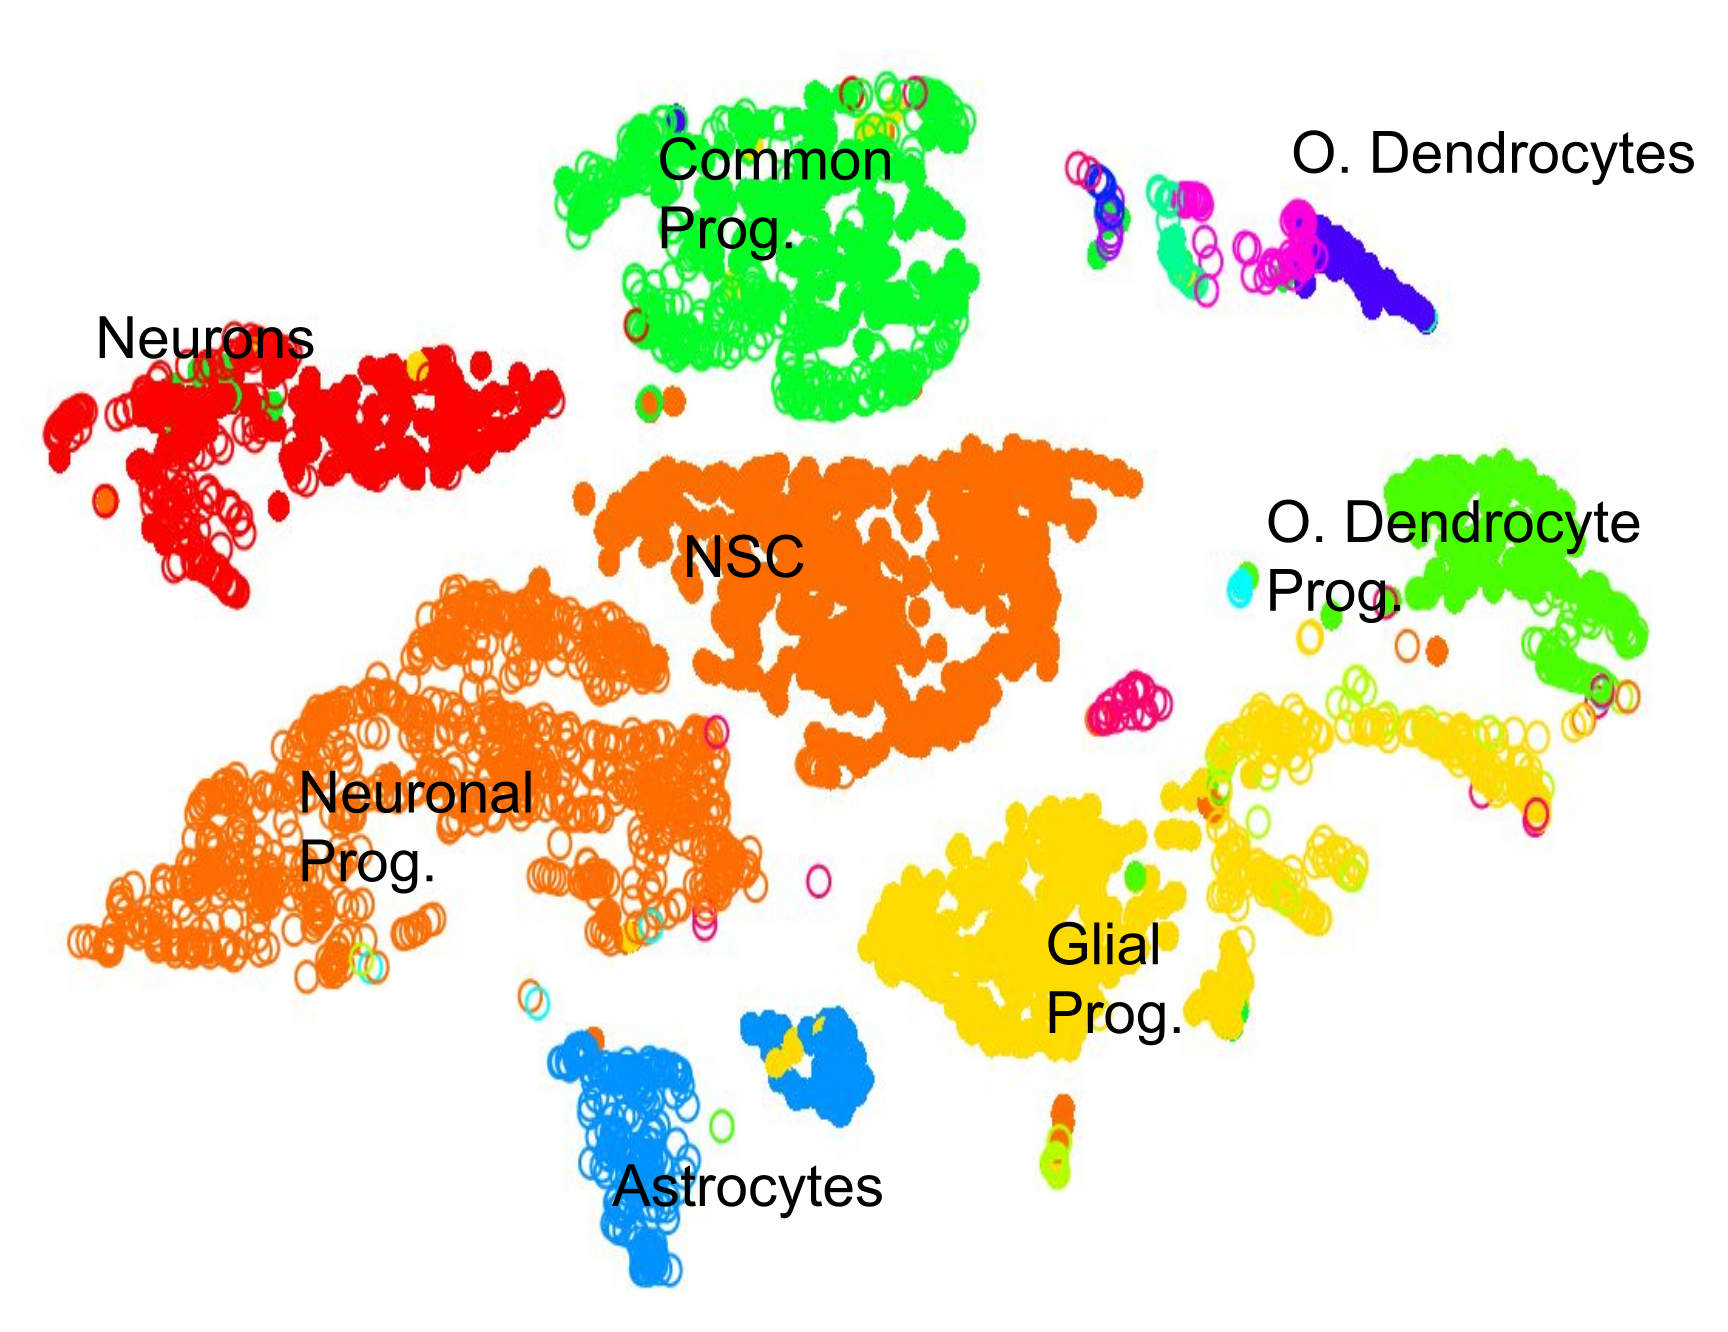
Cell Type: Identifying Cluster Types
.left-column50[.image-100[ ]]
.left-column50[.image-100[
 ]]
]]
Clustering: Hard vs Soft
.pull-left[
.image-100[ ]
]
Hard
- Big spaces between clusters
- Cell types are well defined and the clustering reflects that
]
–
.pull-right[
.image-100[ ]
]
Soft
- Clusters bleed into one another
- Cell types seem to intermingle with one another.
]
Speaker Notes Why? Why would there be clusters so close to one another?
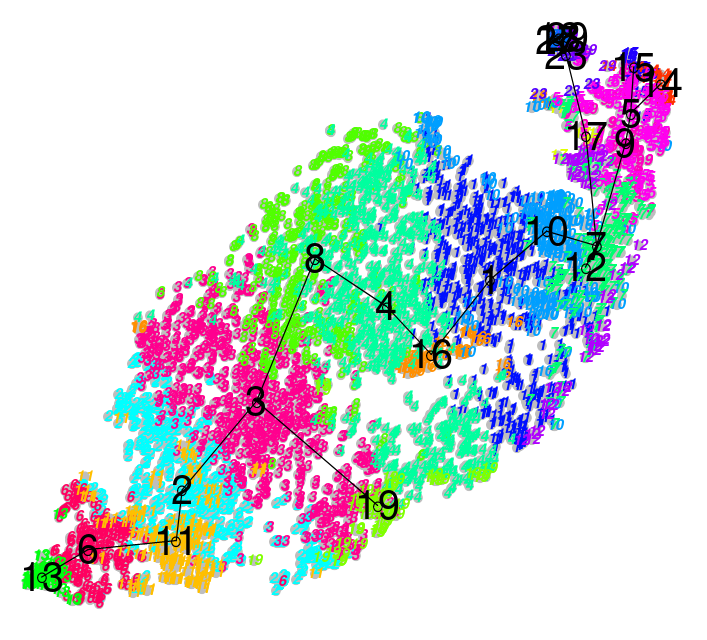
Continuous Phenotypes:
.image-100[
Speaker Notes
-
Cells aren’t discrete, they transition
-
Continuously changing over time from a less mature type to more mature type
Interactive Environments: live.usegalaxy.eu
Speaker Notes What is Differential Expression in scRNA-seq?
CellxGene Local Test
-
We can probe clusters to see how they are so differentially expressed
pip3 install cellxgene cellxgene launch https://cellxgene-example-data.czi.technology/pbmc3k.h5ad -
Launch locally: http://127.0.0.1:5005
Key Points
- Understanding the purpose of barcoding
- Knowing the difference between hard and soft clustering
- A KNN graph can be generated from a count matrix.
- Community clustering can be generated from a KNN graph.
- Interpreting scRNA-seq plots
Thank you!
This material is the result of a collaborative work. Thanks to the Galaxy Training Network and all the contributors! This material is licensed under the Creative Commons Attribution 4.0 International License.


