Visualization of RNA-Seq results with CummeRbund
Contributors
Questions
How are RNA-Seq results stored?
Why are visualization techniques needed?
How to select our desired subjects for differential gene expression analysis?
Objectives
Manage RNA-Seq results
Extract the desired subject for differential gene expression analysis
Visualize information
Why visualization?
Speaker Notes Data alone does not bring any information: to carry information, data needs to be contextualized. Transcriptomic data is no exception, therefore to organize the growing body of knowledge pertaining RNA-Seq experiments and infer valuable insights, data needs to be organized, annotated, and ultimately visualized.
Where is my data coming from?
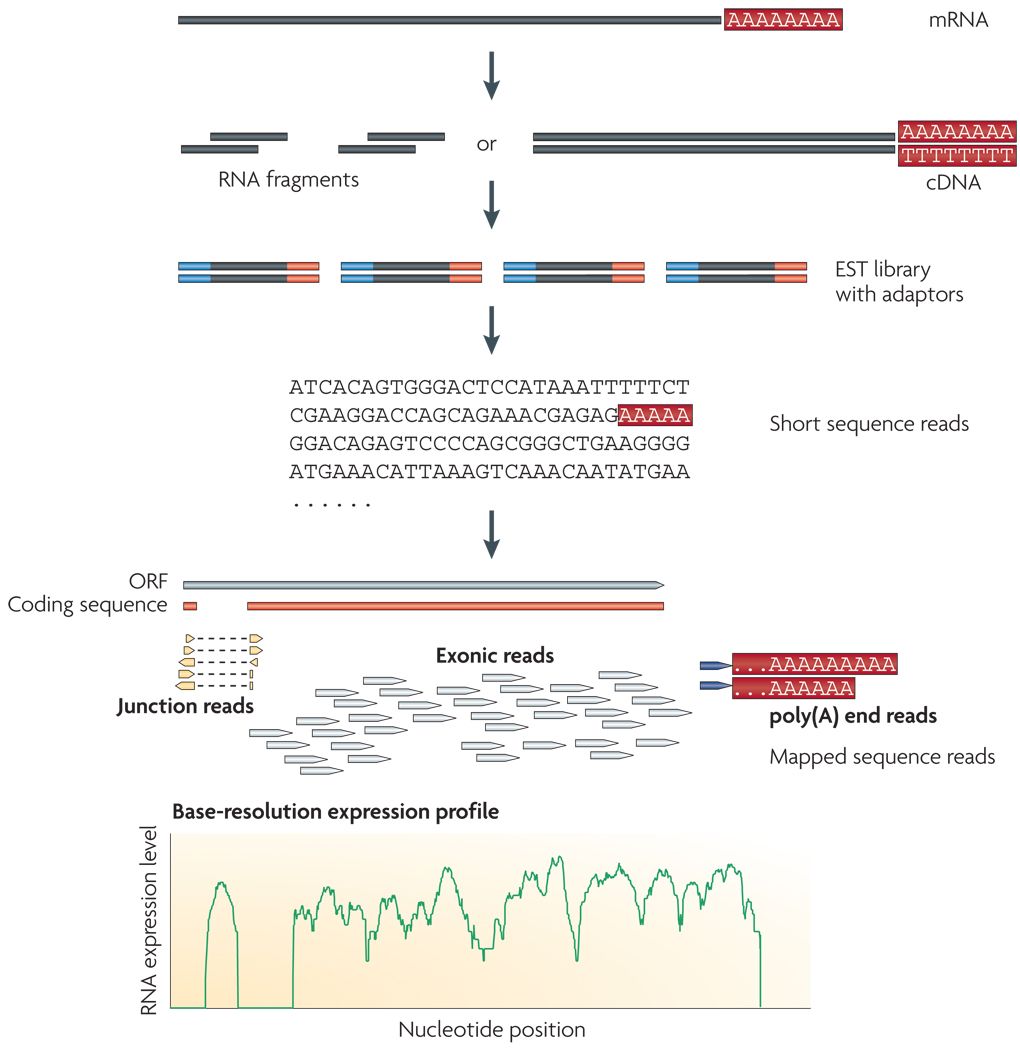
Wang et al, Nat Rev Genet, 2009
Speaker Notes
- RNAs are converted into cDNA fragments through RNA fragmentation
- sequencing adaptors (in blue) are then added to each cDNA fragment
- cDNA sequences are obtained via NGS sequencing
- the obtained reads are subsequently aligned against a reference genome or transcriptome, and classified in-silico as exonic reads, junction reads, and poly-A reads
- these three types are then used to outline an expression profile for each gene
This is the process that will:
- reveal new genes and splice variants
- help quantifying cell-specific gene expression within the genome under study
But once this pipeline is implemented, how are sequence data going to be analysed and managed?
Bioinformatic tools for RNA-Seq analysis
Once the RNA-Seq pipeline is implemented, we still need to handle and analyse all data that is generated. This requires:
-
computer science skills to be handled
-
mathematical knowledge to be interpreted
Bioinformatic tools for RNA-Seq analysis
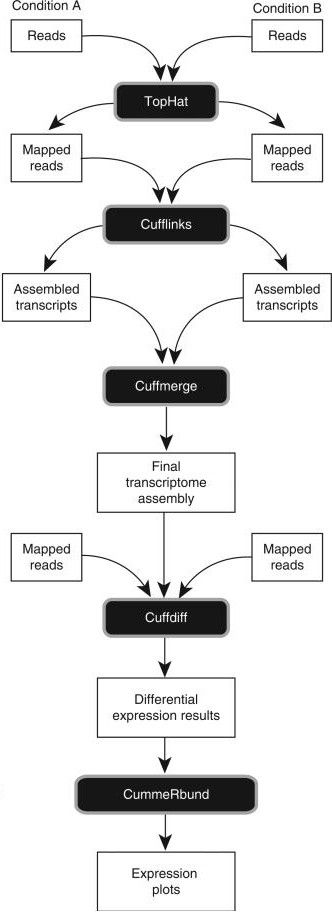
Trapnell et al, Nat Protoc, 2012 Speaker Notes
- first, reads from each condition are mapped to the reference genome using TopHat
- the resulting alignment files are given to Cufflinks, which generates a transcriptome assembly for each condition
- the two assemblies are then merged together to provides a uniform basis for calculating of gene and transcript expression in each condition
- both reads and merged assemblies are fed to CuffDiff, to calculate expression levels via statistical significance test for the observed changes
Bioinformatic tools for RNA-Seq analysis
The last step in our RNA-Seq analysis is CuffDiff. Its output comprises multiple files containing the results of the differential expression analysis.
-
Gene expression levels are reported as tab-separated values: a simple tabular output that can be viewed with any spreadsheet application. Such files contain statistics, gene-related, and transcript-related attributes .image-75[
 ]
] -
Another way to collect all these data is to organize it within a dedicated database for later consultation. CuffDiff can be instructed to do so .image-50[
 ]
]
Speaker Notes
- CuffDiff provides analyses of differential expression and regulation at the gene and transcript level
- its results are reported in a tab separated format
- the overall collection of data is difficult to read to obtain a bird’s-eye view of the change of expression
- the data can be organized in a SQLite database
Bioinformatic tools for RNA-Seq analysis
Whatever storage strategy you opted for, i.e. multiple tab-separated-value files or a SQLite database, all data is still retained within text format.
We need to have a bird’s-eye view of that data, and make sense of it
Visualization
CummeRbund
CummeRbund is an R package for visualizing the results of a CuffDiff output.
-
Manages, integrates, and visualizes all data produced by CuffDiff
-
Simplifies data exploration
-
Provides a bird’s-eye view of the expression analysis
-
Helps creating publication-ready plots
CummeRbund
CummeRbund needs to be instructed on which data to be visualized:
-
Extract CuffDiff’s “Transcript differential expression testing” table
-
Filter the table on the column storing the significance of a differentially expressed gene
-
Sort all entries on the basis of most significant differentially expressed gene
-
Identify the most significant differentially expressed gene
CummeRbund
Once the most significant differentially expressed gene has been identified, CummeRbund can generate publication-ready plots to highlight…
.image-50[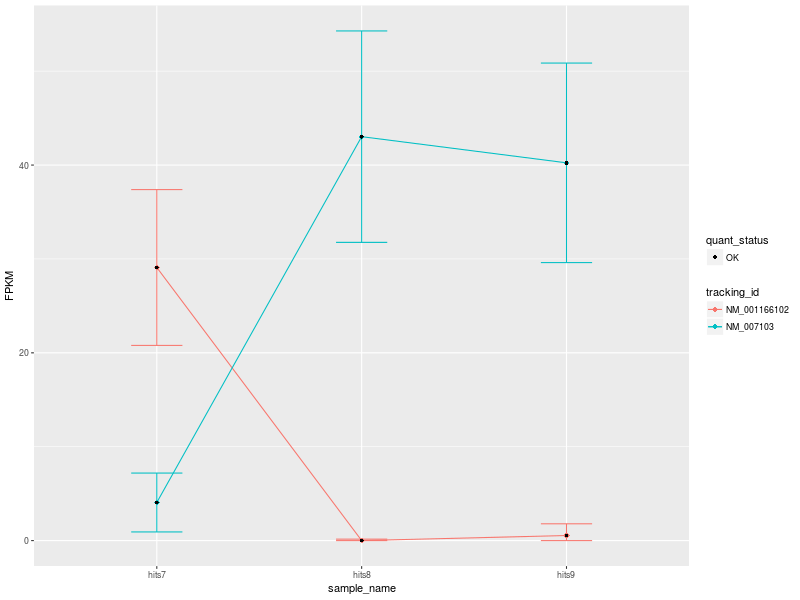 ]
]
The expression of all isoforms of the single gene with replicate FPKMs
CummeRbund
Once the most significant differentially expressed gene has been identified, CummeRbund can generate publication-ready plots to highlight…
.image-50[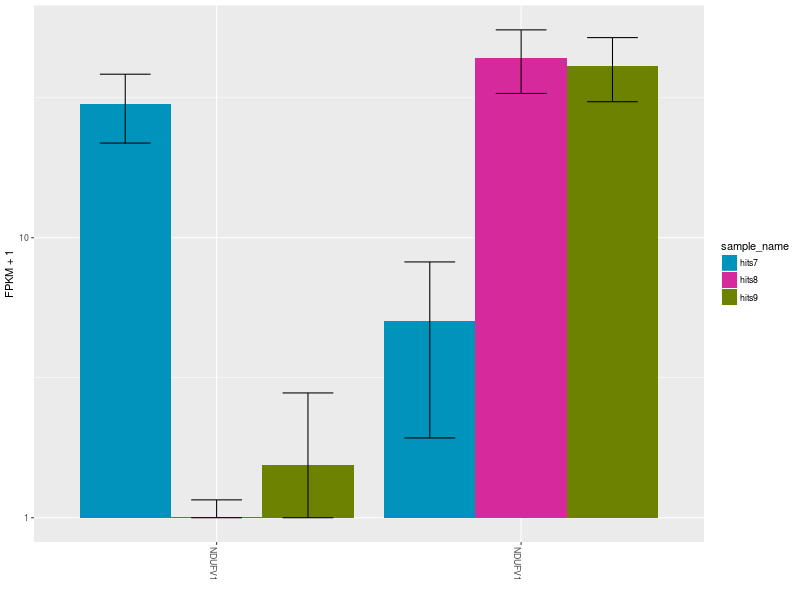 ]
]
The expression bar-plot of all isoforms of a gene with replicate FPKMs
CummeRbund
…and many more
.image-50[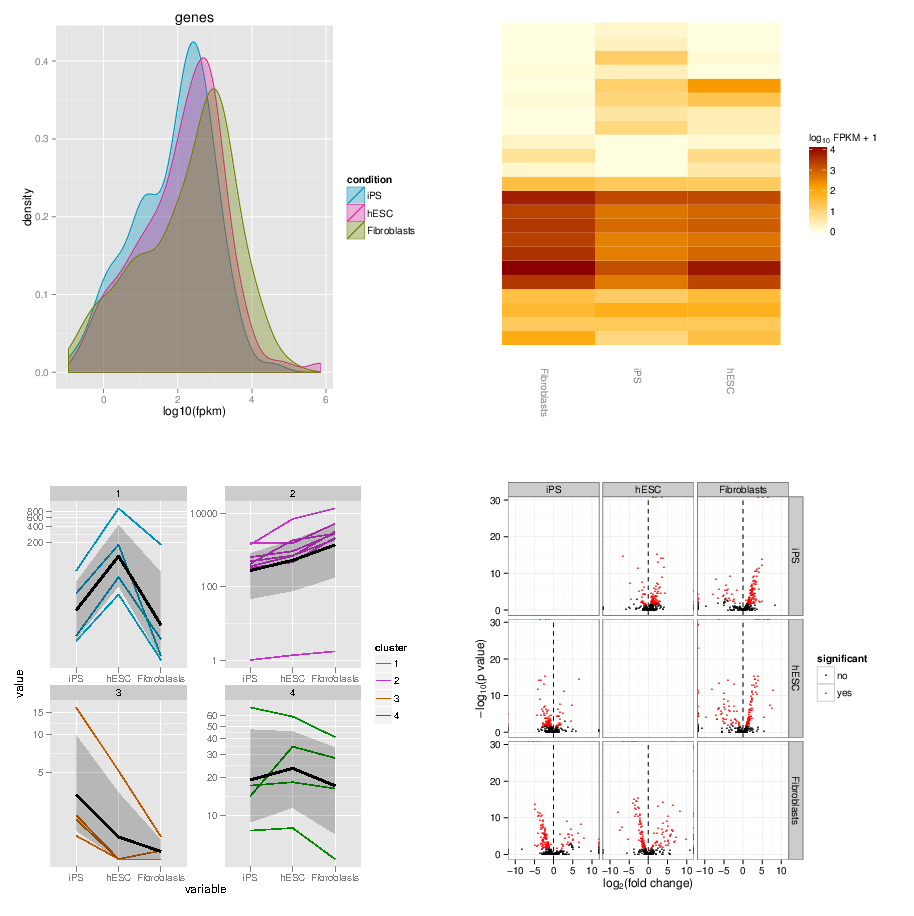 ]
]
Have a look at CummerBund’s tutorial to overview all possibilities!
Key Points
- Extract informations from a SQLite CuffDiff database
- Filter and sort results to highlight differential expressed genes of interest
- Generate publication-ready visualizations for RNA-Seq analysis results
Thank you!
This material is the result of a collaborative work. Thanks to the Galaxy Training Network and all the contributors! This material is licensed under the Creative Commons Attribution 4.0 International License.